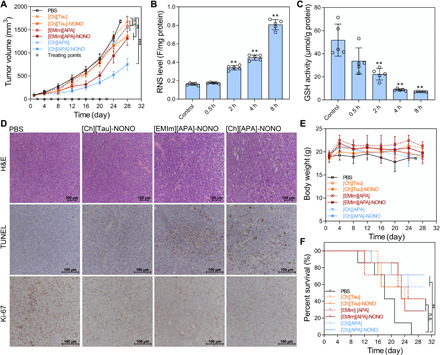
Fig. 5. IL-NONOates impair tumor growth and induce tumor regression.

CT-26 tumor–bearing BALB/c mice were treated with PBS, [Ch][Tau], [EMIm][APA], [Ch][APA], [Ch][Tau]-NONOate, [EMIm][APA]-NONOate, and [Ch][APA]-NONOate. (A) Tumor volume (in mm3) profile of treatment groups. The circle point (○) represented the day of treatment. (B) Quantitative analysis of intratumoral RNS levels. (C) Quantitative analysis of intratumoral GSH levels. The error bars represented means ± SD and n = 7. The P values were calculated by the Student’s t test (n.s., no significance; **P < 0.01 and ***P < 0.001). (D) Immunohistochemical analyses of hematoxylin and eosin (H&E), TUNEL, and Ki-67 for CT-26 tumor tissues from each group after treatments. (E) The average body weights of the treatment groups. (F) Kaplan-Meier survival curves of the treatment groups. The P values were calculated by the log-rank test (n = 7, **P < 0.01).
