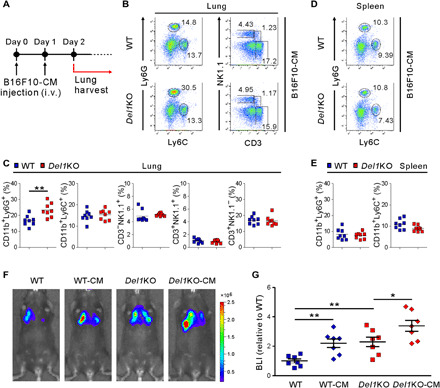
Fig. 5. CM from B16F10 cells induces neutrophil accumulation in the lung microenvironment.

(A) Schematic diagram showing the schedule for B16F10-CM treatment. WT and Del1KO mice (n = 8 each group) were intravenously administered with B16F10-CM for two consecutive days. Mice were euthanized the next day after the last B16F10-CM treatment. (B and C) Representative (B) and quantitative (C) flow cytometric analysis of myeloid cells and lymphocytes, graphed on Ly6C by Ly6G and CD3 by NK1.1 dot plots, respectively, among CD45+ cell populations in the lungs depicted in (A). (D and E) Representative (D) and quantitative (E) flow cytometric analysis of myeloid cells, graphed on Ly6C by Ly6G dot plots, among CD45+ cell populations in the spleens depicted in (A). (F and G) Representative images (F) and quantification (G) of lung metastasis in WT or Del1KO mice (n = 7 each group) after administration of media or B16F10-CM as depicted in (A) and then injection of B16F10-Luc2 cells by luciferase-based bioluminescence imaging (BLI). One day after the last B16F10-CM treatment, mice received an intravenous injection of B16F10-Luc2 cells. Horizontal bars indicate the means (C and E). *P < 0.05; **P < 0.01.
