
Fig. 2. High-resolution microscopy of the four samples.
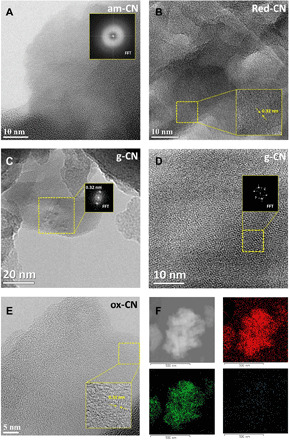
(A) Representative HRTEM image of am-CN. Inset: FFT of a selected area showing the pattern of a typical amorphous material. (B) Representative HRTEM image of red-CN. Inset: High magnification of a selected area, showing the crystal lattice fringes, where a 0.32-nm interlayer spacing is measured. (C) Representative HRTEM of g-CN with the FFT (inset) showing spots assigned to the expected 0.32-nm interlayer spacing and (D) high magnification of a selected area of (C) with the FFT showing the intralayer XRD pattern with a 0.68-nm spacing. (E) Representative HRTEM image of ox-CN with the inset showing the lattice fringes with the 0.32-nm interlayer spacing and (F) EDX elemental mapping of ox-CN: carbon (red), nitrogen (green), and oxygen (blue).