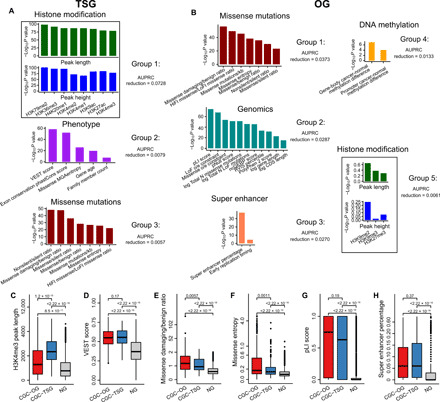
Fig. 1. Features that discriminate TSGs from OGs.

(A) Feature groups selected for TSGs. (B) Feature groups selected for OGs. Feature groups are sorted according to the AUPRC reduction in elastic net fivefold cross-validation. Feature groups are named according to the representative features. Box plots showing the distribution of (C) H3K4me3 mean peak length, (D) VEST score, (E) missense damaging/benign ratio, (F) missense entropy, (G) pLI score, and (H) super enhancer percentage for the CGC-OG, CGC-TSG, and NG sets. Genes as both TSGs and OGs are excluded. P values for the differences between the TSGs/OGs and NGs were calculated by the one-sided “greater than” Wilcoxon rank-sum test.
