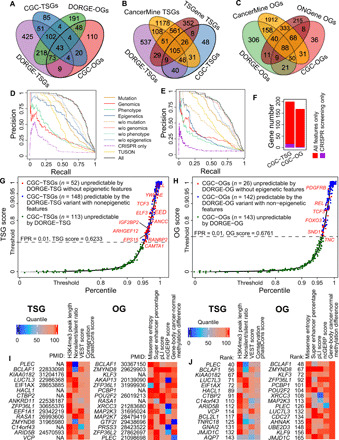
Fig. 2. Evaluation of the DORGE method and characterization of the DORGE-predicted novel TSGs and OGs.

Venn diagrams showing the overlap (A) between DORGE-predicted novel TSGs/OGs and CGC-TSGs/OGs; (B) between DORGE-predicted novel TSGs, CGC-TSGs, CancerMine-TSGs, and TSGene database-TSGs; and (C) between DORGE-predicted novel OGs, CGC-OGs, CancerMine-OGs, and ONGene database-OGs. Precision-recall curves (PRCs) for (D) TSG and (E) OG prediction. Different lines represent different PRCs from DORGE or DORGE variants. (F) Stacked bar plots showing the number of rediscovered CGC-TSGs and CGC-OGs using all features compared to CRISPR-screening data only. Cumulative distribution function (CDF) plots of DORGE-predicted TSG scores (G) and OG scores (H) of 19,636 human genes. The x axis and the y axis are swapped for illustration purposes, and the y axis is stretched to emphasize large TSG and OG scores. CGC genes are plotted as jitter points to avoid overplotting. The dashed lines indicate DORGE-TSG and DORGE-OG thresholds at a target FPR of 1%, and the CGC genes whose TSG scores and OG scores exceed the thresholds (above the dashed lines) are predicted as TSGs and OGs. (I) Top 15 DORGE-predicted non-CGC novel TSGs (left) and OGs (right), respectively, along with representative feature heatmaps and PubMed IDs. To make features comparable, feature values are transformed into quantiles. (J) Top 15 DORGE-predicted non-CGC novel TSGs (left) and OGs (right) that have no documented role in cancer based on the TSGene, ONGene, and CancerMine databases, along with representative feature heatmaps.
