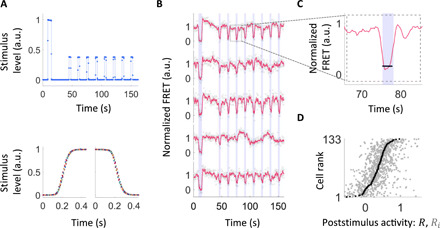
Fig. 1. Statistics of signaling variability from single-cell FRET with fast stimulus modulation.

(A) Fast and precise control of input stimuli within our bespoke microfluidic device. Top: Temporal profile of the ligand stimulus within the device, measured using a fluorescent dye. Our stimulus protocol involves one large stimulus followed by eight subsaturating step stimuli. Bottom: Superimposing multiple stimulus time series (each in a different color) demonstrates fast and highly reproducible relaxation for both steps up (left) and steps down (right). For a drawing and more details of the device, see fig. S1. (B) Responses are highly variable both across isogenic cells from the same growth culture and over time within the same cell. Response time series (FRET signal normalized by its steady-state level) for 5 representative cells out of the 133 measured in a single experiment are shown. Blue shading indicates times at which MeAsp step stimuli were applied (4 μM, except the first stimulus, which was 0.5 mM). Gray circles indicate FRET response, and red lines indicate its moving average with a 1.5-s window. (C) Poststimulus activity is defined as the median FRET signal level (black line) during the 3-s step stimulus (blue shading) relative to the steady-state FRET level. (D) Summary of response variability upon 4 μM MeAsp steps for all 133 cells measured in the experiment of (B). All responses (poststimulus activities) Ri (light gray) upon repeated application of identical steps are shown for every measured cell, sorted by rank of their median response R (dark gray). Note that Ri and R can take negative values due to measurement noise (fig. S2). The cumulative distribution of median response (traced out by the R point series) is broad, indicating extensive diversity across cells. a.u., arbitrary units.
