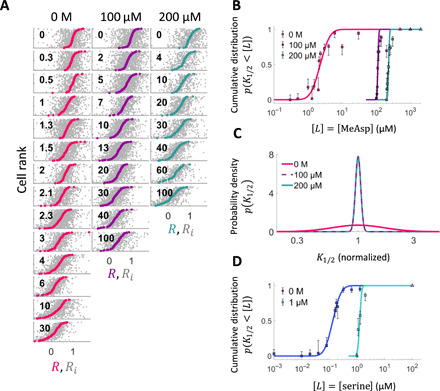
Fig. 3. K1/2 distributions at different background concentrations reveal diversity tuning of response sensitivity.

(A) Summary of responses to step stimulation by MeAsp (gray dots: response to individual steps Ri, colored dots: median response of each cell R). Background concentration ([L]0) and step size (Δ[L]) are shown in μM at the top and within each panel, respectively. Cells are sorted by their median response. (B) Cumulative distribution of K1/2, p(K1/2 < [L]), of responses to MeAsp in cells adapted to three different background concentrations of MeAsp, [L]0 = {0,100,200} μM, constructed from the data in (A) through the procedure outlined in Fig. 2. Curves represent fits by log-normal distributions. Error bars are 95% bootstrap CIs. The concentrations of stimuli used to define saturating responses are indicated by the triangles. (C) The distributions of K1/2 computed from the fits in (B) reveal that diversity in K1/2 is strongly attenuated upon adaptation to both 100 and 200 μM MeAsp. Note that in this panel, the distribution at each background concentration is centered by normalizing K1/2 by the mode of the distribution to facilitate visual comparison. (D) Cumulative distribution of K1/2, p(K1/2 < [L]), of responses to serine in cells adapted to different background concentrations of serine, [L]0 = {0,1} μM.
