
Fig. 4. Zic2 regulates many genes involved in the Wnt signaling pathway.
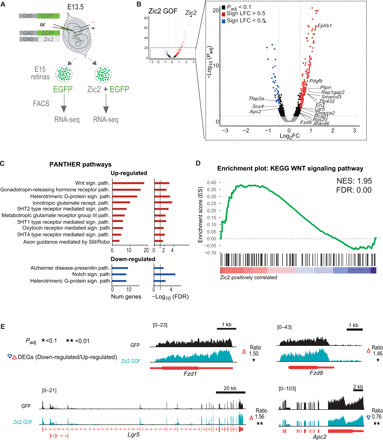
(A) Scheme representing the experimental design of the RNA-seq screen. FACS, fluorescence-activated cell sorting. (B) Volcano plot showing differentially expressed genes (DEGs) 36 hours after Zic2 electroporation in contralateral RGCs. The name of relevant DEGs is indicated in the amplification inset. The significance value for the change in Zic2 is above the scale. LFC, log2 fold change. (C) PANTHER pathway enrichment analysis of genes up-regulated (top graphs) and down-regulated (bottom graphs) after Zic2-induced expression in RGCs. The bar graphs present the significance of the enrichment (right) and the number of genes involved (left). (D) GSEA of DEGs after Zic2 transduction of RGCs detects a nonrandom distribution of genes involved in Wnt signaling. The normalized enrichment score (NES) and false discovery rate (FDR) values are shown in the upper right corner of the graph. (E) Examples of RNA-seq profiles from relevant Wnt signaling genes down-regulated (Apc2) or up-regulated (Fzd1, Fzd8, and Lgr5) by Zic2.