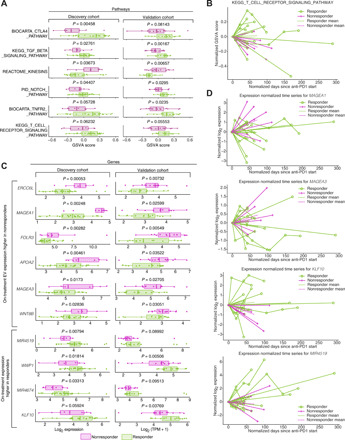
Fig. 2. Biological pathways and genes that stratify responders and nonresponders in on-treatment EV profiles.

(A) MSigDB canonical (C2) pathway enrichments in on-treatment samples, (purple color, discovery cohort; green color, validation cohort). (B) Time dynamics of T cell receptor Kyoto Encyclopedia of Genes and Genomes (KEGG) signaling in responders versus nonresponders visualized using single-sample gene set enrichment scores derived from GSVA analysis. Individual patient progressions are displayed as connected lines. Both the start time and the relative expression levels were normalized against the time and GSVA score at the first sample collection point. The mean GSVA score changes for responders and nonresponders are plotted in bold green (responders) and purple (nonresponders) lines. (C) Expression comparison between responders (green) and nonresponders (purple) for selected validated DEGs between responders (green) in on-treatment samples across both the discovery and validation cohort. The P values displayed are generated from limma. (D) Time dynamics of several representative validated on-treatment DEGs, including MAGEA1, MAGEA3, KLF10, and MIR4519, in the discovery cohort. Individual patient progressions are displayed as connected lines. Both the start time and the relative expression levels were normalized against the time and expression at the first sample collection point, which were set to 0. The mean expression changes for responders and nonresponders are plotted in bold green (responders) and purple (nonresponders) lines.
