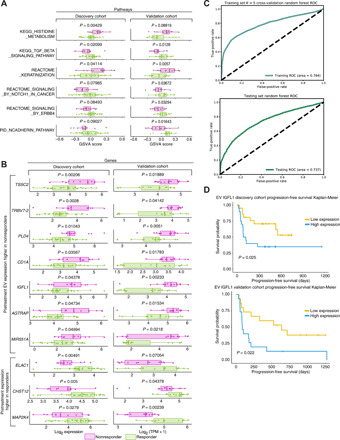
Fig. 3. Biological pathways and genes stratifying responders/nonresponders in pretreatment EV profiles.

(A) GSVA scores and P values for selected MSigDB pathways differing significantly between responders (green) and nonresponders (purple). (B) Box plots of expression of selected validated pretreatment EV DEGs between responders/nonresponders in the discovery and validation cohorts (purple, nonresponders; green, responders). (C) ROCs generated by a random forest classifier36 using validated pretreatment DEGs to predict response versus nonresponse from EV transcriptomes. To minimize platform-specific differences confounded with response, we used 100 distinct, randomized partitionings of the combined discovery and validation cohorts. Within each 100 trial, we conducted stratified K = 5 internal cross-validation within the training set to determine optimal hyperparameters for a random forest classifier predicting binary response from EV transcriptomes (Materials and Methods): The optimal hyperparameter set and internal cross-validation predictive performance was saved. We used optimal hyperparameters from cross-validation to create a classifier trained on the entire training set and used this to generate predictions for the testing set. We combined predicted results and ground truths across all 100 trials and generated the ROC plot and AUROC values for internal cross-validation within the training set (top) and the held-out testing set (bottom). (D) Kaplan-Meier overall survival plots and log rank test P values for IGFL1 in the discovery and validation cohorts. High- and low-expression classifications were determined for each patient based on expression of IGFL1 that was in the top half (yellow) of their cohort’s IGFL1 expression level.
