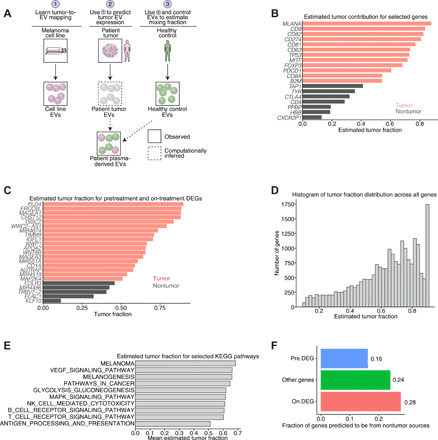
Fig. 4. Deconvolution of EV profiles and analysis of driver mutations in RNA-seq profiles.

(A) Schematic representation of our deconvolution model (see Supplementary Note). (B) Selected tumor contributions from known tumor and nontumor genes. Red denotes predicted tumor, and gray denotes predicted nontumor tissue of origin for a particular gene. (C) Estimated tumor fraction for pretreatment and on-treatment DEGs demonstrates that a majority of DEGs are predicted to come from tumor sources. (D) Histograms of maximum a posteriori (MAP) estimates of tumor fraction from our model across all genes. (E) Average tumor fraction of all genes involved in several selected KEGG categories. (F) Predicted tumor fraction of validated pretreatment DEGs, on-treatment DEGs, and all other genes predicted to be non–tumor derived (i.e., predicted tumor fractions of <0.5).
