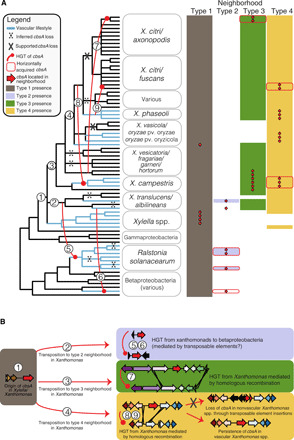
Fig. 3. Repeated horizontal transfer, transposition, and gene loss events drive the distribution of cbsA in Gram-negative bacteria.

(A) A 50% majority-rule consensus tree summarizing 81 conserved single-copy ortholog trees is shown to the left, with the names of the 75 individual isolates consolidated into relevant taxonomic groupings. Inferred HGT, transposition, and loss events are drawn and numbered on the tree and further described in (B). The matrix to the right of tree indicates the presence/absence of one of four distinct genomic neighborhood types (shaded/unshaded cells) in which cbsA homologs are found within a given genome (presence of cbsA indicated by an overlaid red arrow). Note that in many cases, all of the constituent genes making up a specific neighborhood are present in a given genome save for cbsA (indicated by the absence of an overlaid red arrow). cbsA homologs from X. albilineans and X. ampelinus were not found associated with a specific type of neighborhood, but were assigned to the type 2 neighborhood column based on the observation that their closest phylogenetic relatives are sequences in type 2 neighborhoods (see Fig. 1B). This tree has been lightly edited for viewing purposes by removing several taxa from outside the Xanthomonadales and can be viewed in its entirety in fig. S3. (B) Sequence of inferred evolutionary events numbered corresponding to (A). Genomic neighborhood types are represented by schematics, where gene models are color-coded according to OG. The color-coding of neighborhood types is consistent across both panels.
