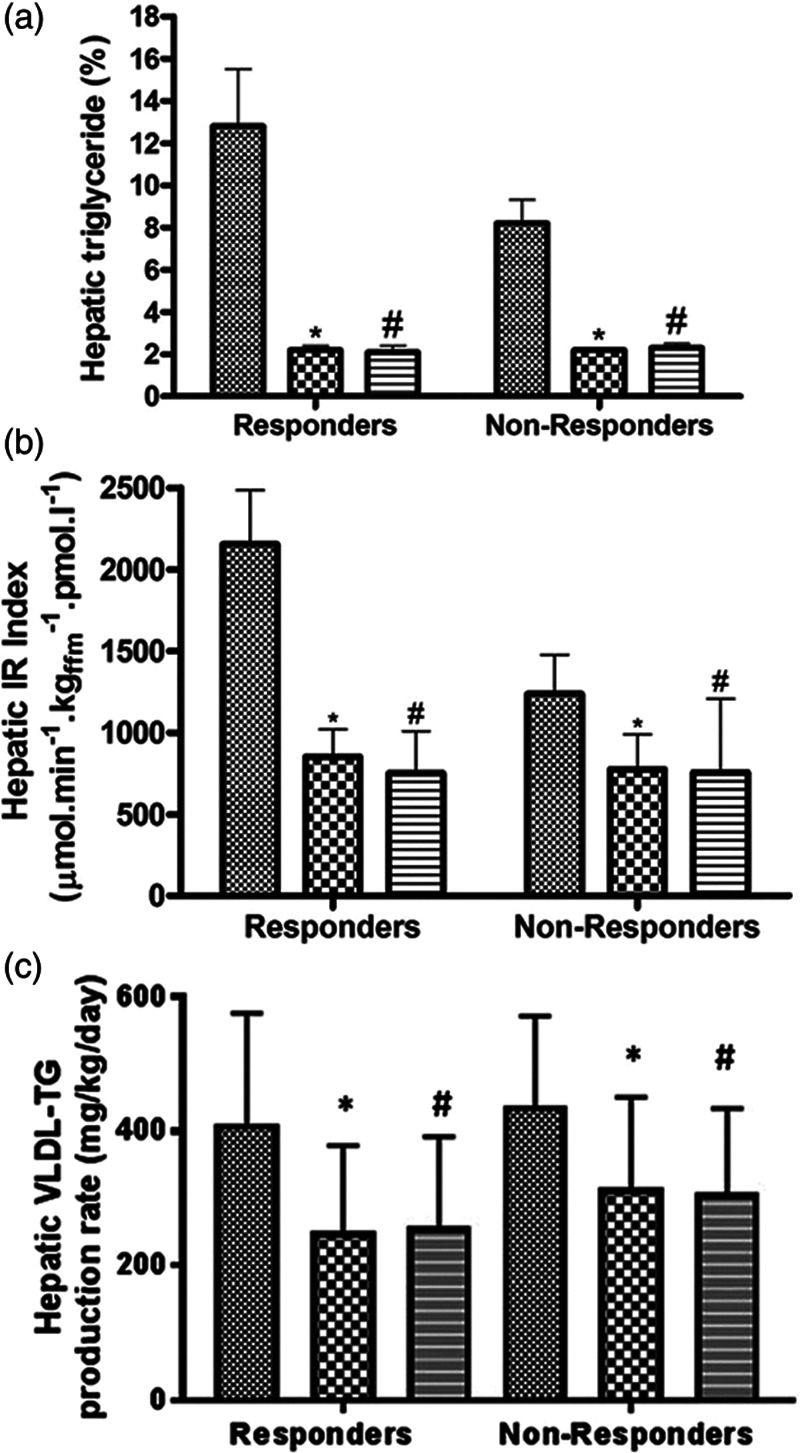
Fig. 2.

Change in liver fat, hepatic insulin resistance, and VLDL-TG production within the Counterbalance study. Hepatic triglyceride content (a), hepatic insulin resistance index (b), and hepatic VLDL1-triglyceride production (c) in those who reversed diabetes (responders: fasting blood glucose <7 mmol/L after return to isocaloric diet) and in those who failed to achieve reverse (nonresponders) at baseline (hatched bars), after VLCD (checkered bars), and after 6 months of weight maintenance (striped bars). *P < 0.05 for baseline–to–post-VLCD difference; #P < 0.05 for baseline–to–month 6 difference. Taken from [10], with permission from the American Diabetes Association. IR, insulin resistance; T2DM, type 2 diabetes; VLCD: very low calorie diet; VLDL-TG, very low-density lipoprotein triglycerides.
