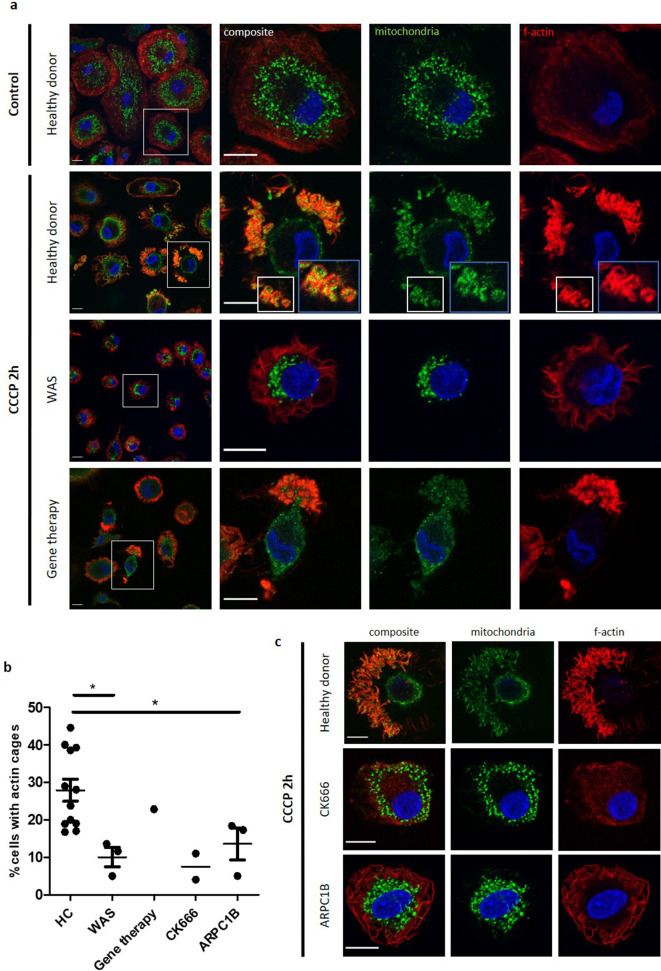
Figure 4. WASp plays an ARP2/3-dependent role in mitophagy.
(a) MDMs from a healthy donor, WAS patient and WAS patient post gene therapy cultured with or without CCCP 10 µM (plus bafilomycin 160 nM) for 2 hr. Cells fixed and stained for mitochondria (biotin, green), f-actin (phalloidin, red) and nuclei (DAPI, blue) and imaged by confocal microscopy. Representative images illustrated at 63x, with higher magnification of areas highlighted by white boxes. Actin cages further magnified from healthy donor, denoted by blue boxes (inset). Scale bars = 10 µm. (b) Healthy donor (n = 7), WAS patient (n = 2), WAS patient post-gene therapy (n = 1), CK666 100µM-treated healthy donor (n = 1) and ARPC1B-deficient patient (n = 3) MDMs cultured with CCCP 10 µM (plus bafilomycin 160 nM) for 2 hr. Cells fixed and stained for mitochondria and f-actin. Slides blinded prior to imaging and analysis. At least six fields of view per slide were imaged at 63x by confocal microscopy. Cells forming actin cages around mitochondria were analysed from at least 100 cells per slide. Dots represent independent experiments, with bars denoting mean +/- SEM. Two-tailed t-test *p<0.05. (c) Representative images of healthy donor, CK666 100µM-treated healthy donor and ARPC1B-deficient MDMs cultured with CCCP 10 µM (plus bafilomycin 160 nM) for 2 hr. Cells fixed and stained for mitochondria (biotin, green), f-actin (phalloidin, red), and nuclei (DAPI, blue) and imaged by confocal microscopy at 63x. Scale bars = 10 µm. CCCP, carbonyl cyanide m-chlorophenylhydrazone; DAPI, 4’,6-diamidino-2-phenylindole; HC, healthy control; MDM, monocyte-derived macrophage; SEM, standard error of the mean; WAS, Wiskott Aldrich syndrome.


