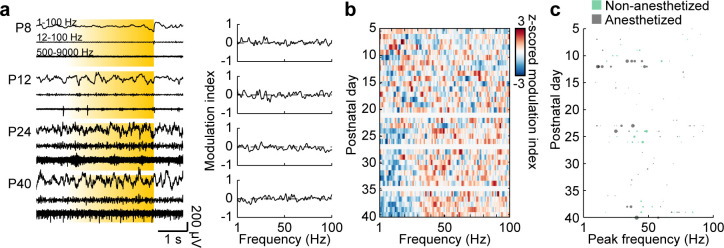
Figure 3. Development of L2/3 PYR-driven gamma in the mPFC.
(a) ChR2(ET/TC)−2A-RFP-expression in L2/3 PYRs in mPFC after IUE at E15.5 in a coronal slice of a P10 mouse. (b) Characteristic examples of extracellular recordings of LFP and MUA during ramp light stimulations (473 nm, 3 s) of prefrontal L2/3 PYRs at different ages (left) and the corresponding MI of power spectra (right). (c) Z-scored average MI of power spectra for P5-40 mice (n = 115 recordings from 101 mice). (d) Scatter plot displaying stimulus induced peak frequencies during postnatal development for anesthetized (gray, n = 80 recordings/mice) and non-anesthetized mice (green, n = 35 recordings from 21 mice). Marker size displays peak strength. (See Supplementary file 1 for a summary of experimental conditions. See Supplementary file 2 for statistics).


