. 2020 Oct 28;9:e53734. doi: 10.7554/eLife.53734

Figure 3. FORCP protein is localized to the endoplasmic reticulum and its knockdown leads to growth advantage.

(A, B) Confocal microscopy was performed following transfection of 293 T cells with GFP wt, GFP with mutated ATG (GFP mut), or FORCP-GFP mut. Immunostaining for the ER marker PDI (B) shows colocalization of FORCP-GFP mut with PDI. DNA was counterstained with DAPI. (C) Confocal microscopy (left panel) following immunostaining of LS180 cells with anti-FORCP and anti-PDI antibodies shows colocalization of endogenous FORCP with the ER marker PDI. DNA was counterstained with DAPI. Colocalization of FORCP and PDI (right panel) was analyzed using ZEISS ZEN Desk microscope software from 100 individual cell images and converted to percentage co-localization. (D–H) The effect of FORCP knockdown in SW1222 cells on proliferation and tumorigenicity was assessed by Incucyte live cell proliferation assays (D), colony formation assays (E–G) and mouse xenograft experiments (H). Image from a representative colony formation on plastic experiment is shown in panel E and the data from three experiments is quantitated in panel F. For mouse xenograft experiments ‘N’ refers to the number of tumors 18 days after injecting the mice with SW1222 cells that were transfected for 48 hr with CTL or FORCP siRNAs. Error bars in panels D, F, and G represent SD from three experiments. *p< 0.05, **p< 0.005.

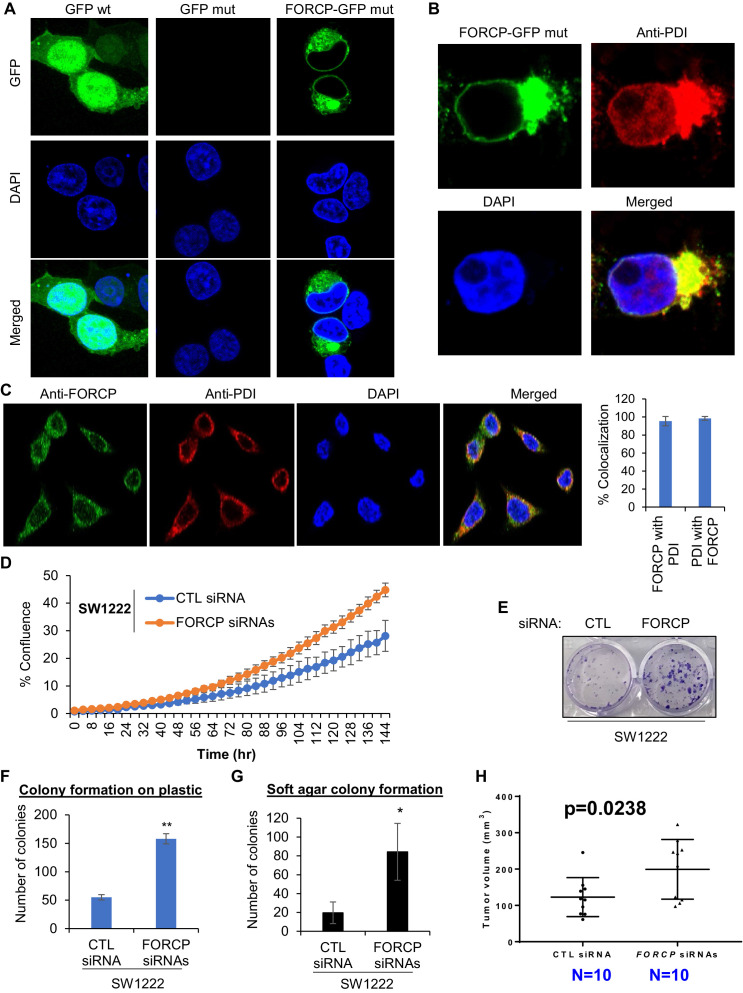
Figure 3.

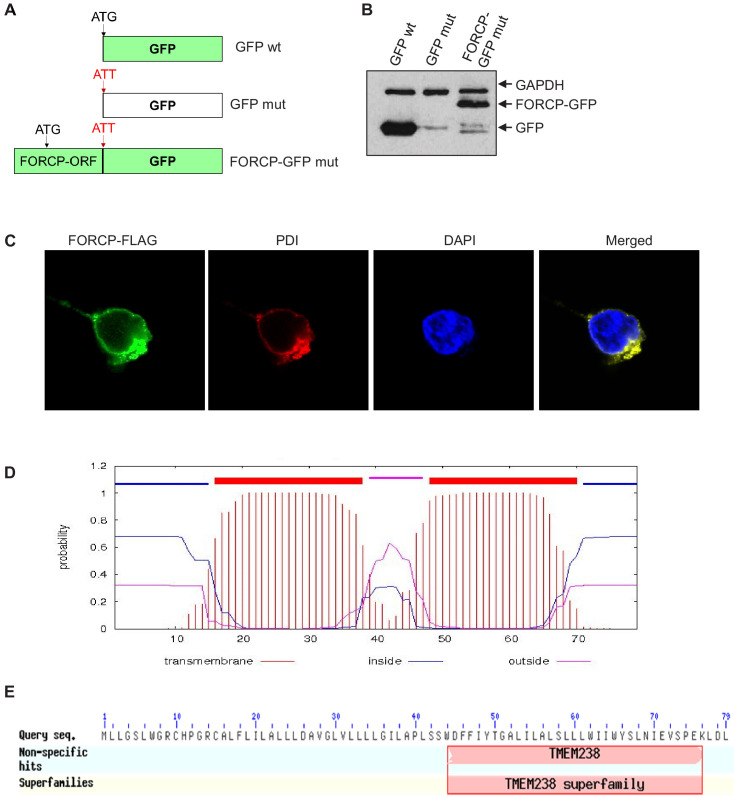
Figure 3—figure supplement 1. Tagged FORCP protein is localized to the ER.

Figure 3—figure supplement 1.

(A) GFP constructs used for confocal microscopy experiments to examine subcellular localization of FORCP protein. (B) Immunoblotting was performed using anti-GFP antibody shows robust expression of the FORCP-GFP and GFP protein upon transient transfection of GFP wt, GFP mut, or FORCP-GFP mut in 293 T cells. GAPDH was used as loading control. (C) Confocal microscopy was performed following transfection of 293 T cells with FORCP-FLAG and immunostaining for the ER marker PDI, using anti-FLAG or anti-PDI, respectively. DNA was counterstained with DAPI. (D) Predicted transmembrane domains in FORCP protein are shown. (E) The C-terminus of FORCP shows homology to TMEM238 superfamily.
Figure 3—figure supplement 1—source data 1. GFP and GAPDH immunoblots for Figure 3—figure supplement 1B.
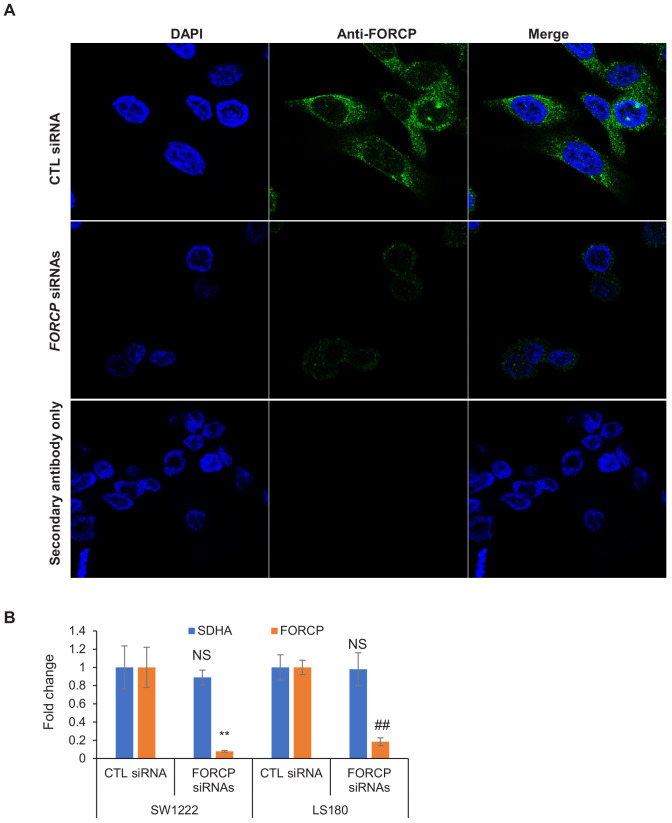
Figure 3—figure supplement 2. Immunostaining experiments show specificity of the FORCP antibody.

Figure 3—figure supplement 2.

(A) Immunostaining was performed for endogenous FORCP using the anti-FORCP antibody 48 hr after transfection of LS180 cells with CTL siRNA or FORCP siRNAs. DNA was stained with DAPI. Secondary antibody alone was used as negative control. (B) FORCP knockdown using smartpool siRNAs was assessed by qRT-PCR 48 hr after transfection of SW1222 and LS180 cells with CTL siRNA or FORCP siRNAs. Housekeeping gene SDHA was used as negative control. Data was normalized to GAPDH. Error bars represent SD from three experiments. **p<0.005, ##p<0.001.