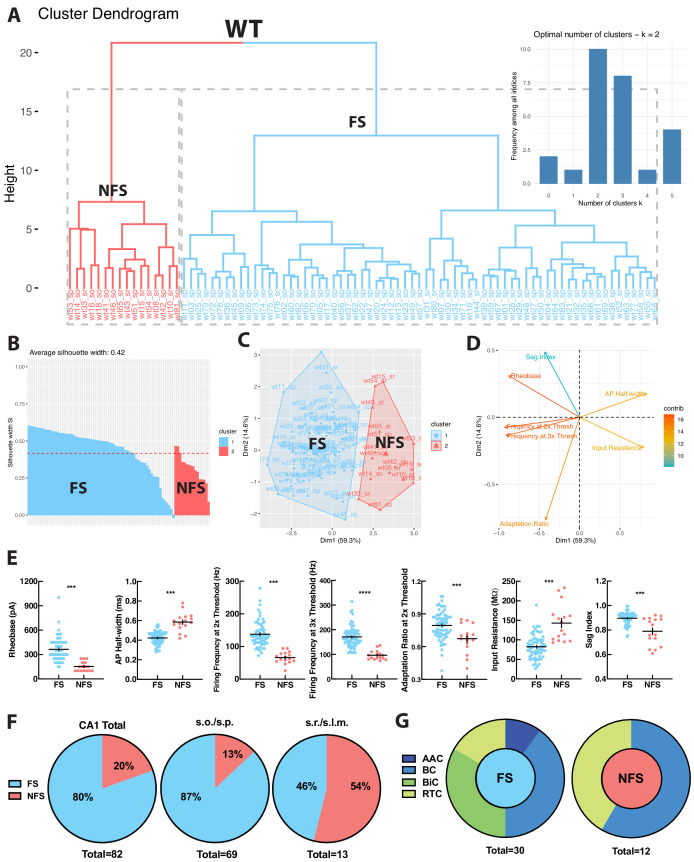
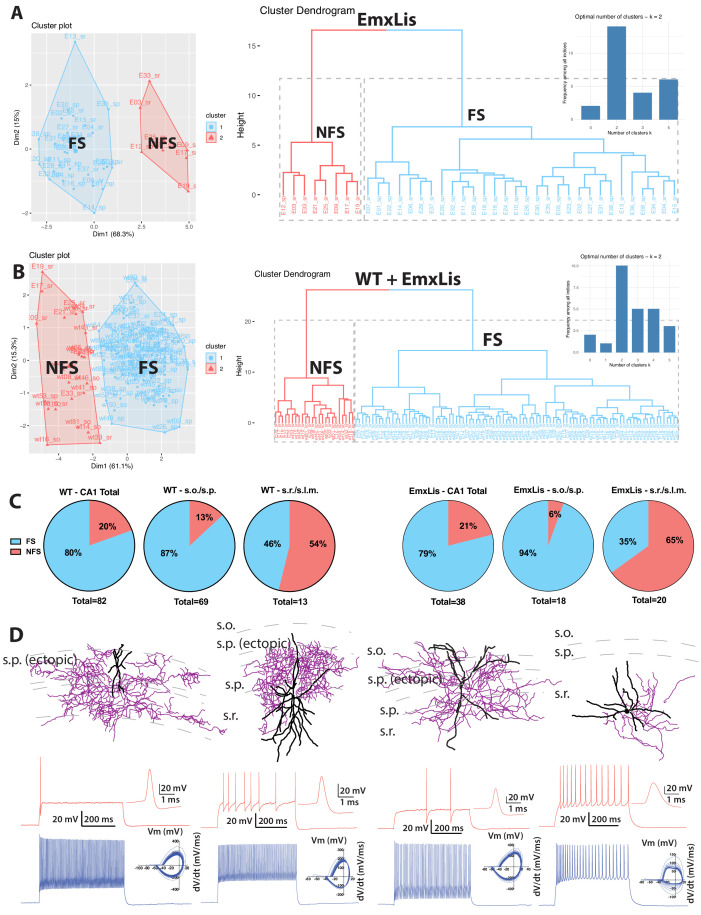
Figure 3. WT PV+INTs consist of two physiological subtypes: FS and NFS cells.
(A) Unbiased cluster analysis dendrogram displays 83 PV+INTs sorted two clusters that represent fast-spiking (FS) and non-fast-spiking (NFS) cells. Inset indicates the optimal number of clusters, determined using NbClust function in R is 2 (FS and NFS). (B) Silhouette plot of the FS/NFS clusters. (C) Cluster plot of the same 83 PV+INTs. Nonoverlap indicates clear segregation of FS/NFS clusters. (D) Contributions of each intrinsic physiological property used in the cluster analysis. (E) Plots displaying and FS/NFS cell intrinsic properties. For statistical analysis *p<0.05, **p<0.01, ***p<0.001, ****p<0.0001. (F) Percentages of FS/NFS cells in CA1 and in each sublayer. (G) Distributions of FS and NFS cell morphological subtypes. FS cells consisted of BCs, AACs, BiCs, and RTCs, whereas all recovered NFS cells were identified as BCs or RTCs.


