. 2020 Nov 5;9:e62373. doi: 10.7554/eLife.62373

Figure 4. GlobalLis PV+INTs consist of three physiological subtypes: FS, IS, and NFS cells.

(A) Unbiased cluster analysis indicates emergence of an additional cluster in GlobalLis CA1, displayed in the dendrogram of 45 PV+INTs. Inset indicates optimal detection of three clusters (FS, IS, NFS). (B) Silhouette plot of the FS/IS/NFS clusters. (C) Cluster plot of the same 45 PV+INTs. (D) Contributions of each intrinsic physiological property used in the cluster analysis. (E) Plots displaying FS/IS/NFS cell intrinsic properties. For statistical analysis *p<0.05, **p<0.01, ***p<0.001, ****p<0.0001. (F) Percentage of FS/IS/NFS cells in CA1 and in each sublayer. (G) Fisher exact test confirms differences in WT and GlobalLis composition of CA1 PV+INT subtypes.

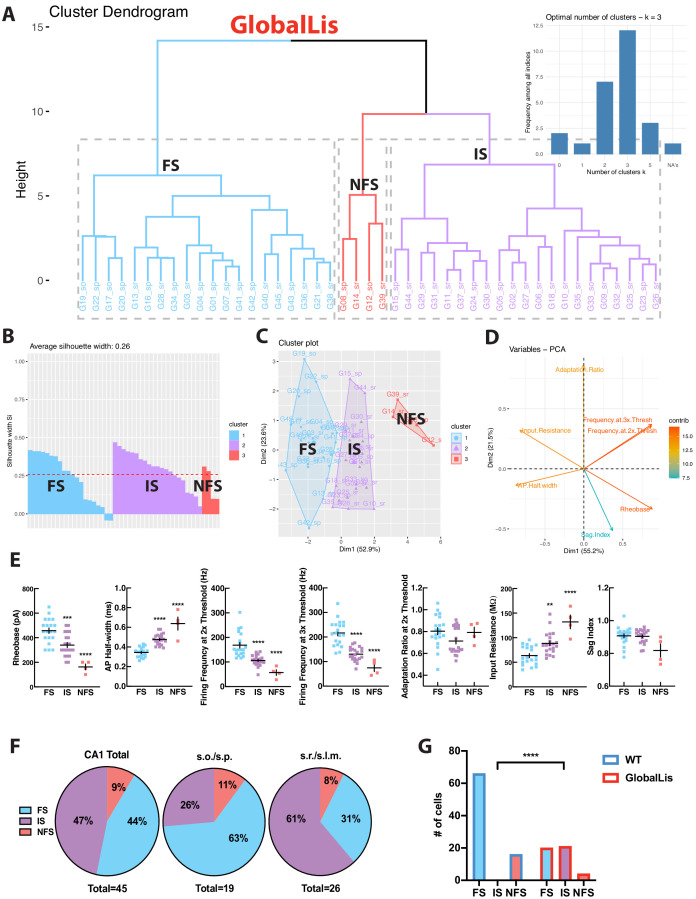
Figure 4.

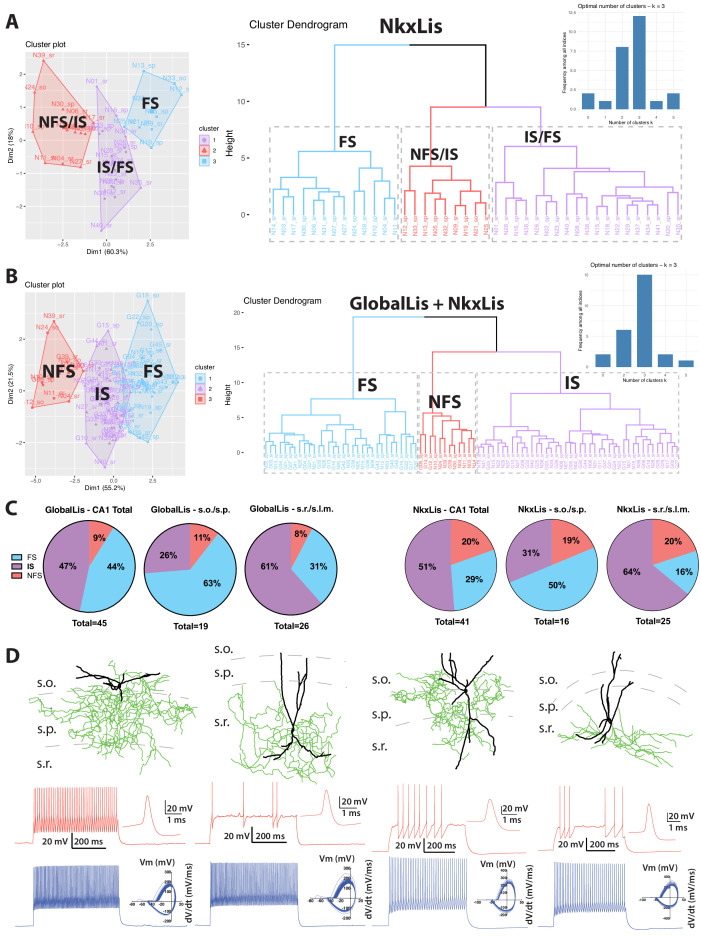
Figure 4—figure supplement 1. Cluster analysis and morphophysiology of NkxLis PV+INTs.

Figure 4—figure supplement 1.

(A) Cluster plot (left) and dendrogram (right) of 41 NkxLis PV+INTs. The dendrogram inset indicates three optimal clusters which correspond to FS and NFS cells. (B) Due to similar sorting, as well as the obvious misclassification some cell types, NkxLis and GlobalLis datasets were analyzed together, which resulted in more reliable classification cell types. (C) Percentages of FS/IS/NFS cells in CA1 and each sublayer. For reference, the GlobalLis distributions (left) are repeated alongside the NkxLis distributions (right). (D) Examples of NkxLis PV+INTs reconstructed cells (dendrite in black, axon in green) and firing traces on bottom (as described in Figure 2). Physiological cell types from left to right: FS, FS, IS, NFS.
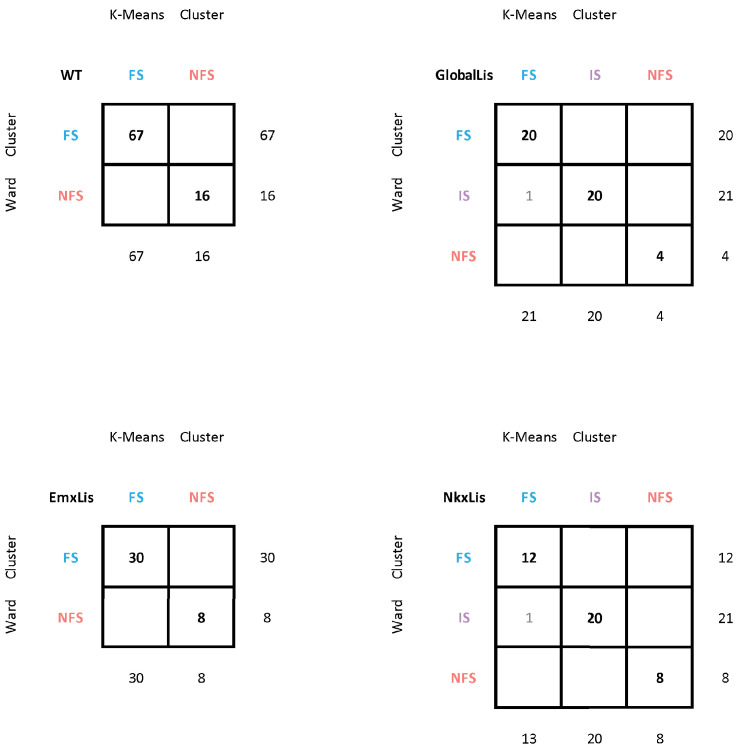
Figure 4—figure supplement 2. Comparison of K-means and Ward clustering.

Figure 4—figure supplement 2.

A Ward Test was performed, and the resulting clusters were compared to results of the original K-means clustering (used in previous figures). The numbers at the bottoms of the column and ends of the row indicate respectively the number of cells in a given K-means or Ward-cluster. The numbers in the table indicate how many cells of a K-means cluster are contained within a given Ward cluster.
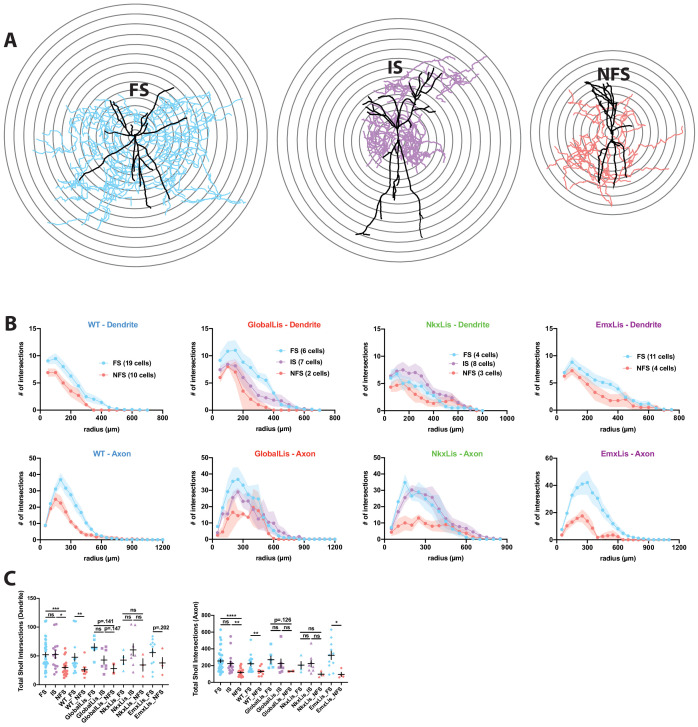
Figure 4—figure supplement 3. Sholl analysis of PV+INT physiological subtypes.

Figure 4—figure supplement 3.

( A) Reconstructions of FS (left), IS (middle) and NFS (right) PV+INTs. Concentric circles (superimposed in black) with a radius interval of 50 µm were used for Sholl analysis. (B) Sholl analysis of dendrites and axons separated by genotype and grouped by physiological subtype. (C) Statistical analysis for individual genotypes and for combined physiological subtype regardless of genotype. For statistical analysis *p<0.05, **p<0.01, ***p<0.001.
Figure 4—figure supplement 3—source data 1. Sholl analysis of PV+INTs.
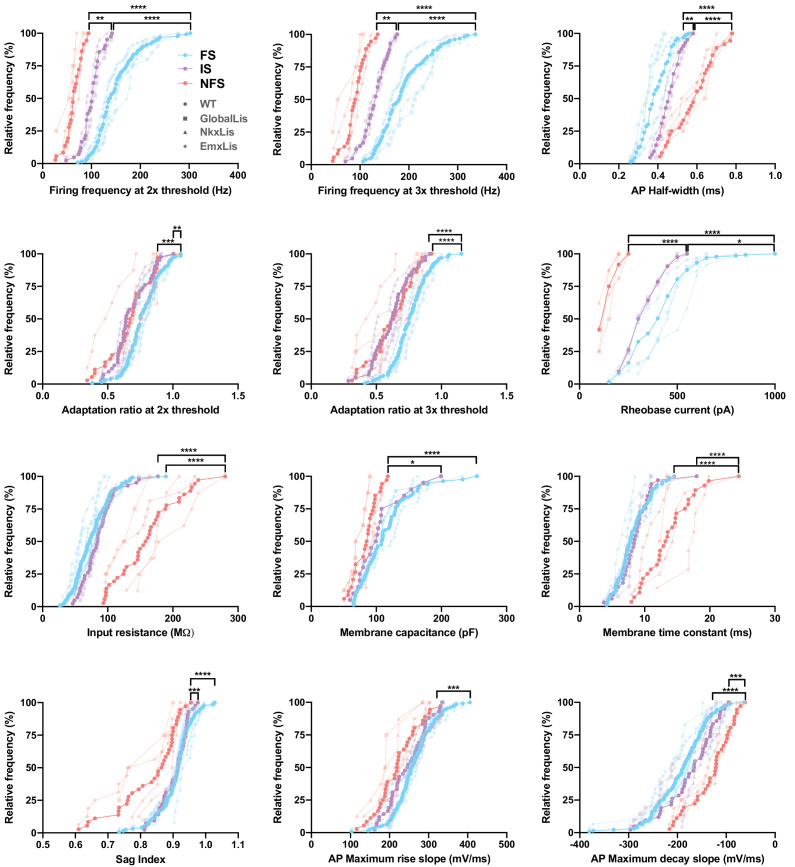
Figure 4—figure supplement 4. Membrane and firing properties of PV+INT physiological subtypes.

Figure 4—figure supplement 4.

Frequency distributions of physiological and morphological properties PV+INTs. FS cells are shown in blue, IS cells in purple, NFS cells in pink. The full color circles connecting lines display the average of all genotypes for each physiological subtype. The faded shapes/lines represent distributions for WT (hexagons), GlobalLis (squares), NkxLis (triangles), and EmxLis (diamonds). Note that with the exception of AP half-width, there were no significant differences between genotypes. Almost every property shown here had significant differences between physiological subtype, independent of genotype. See also Table 1. For statistical analysis *p<0.05, **p<0.01, ***p<0.001, ****p<0.0001.