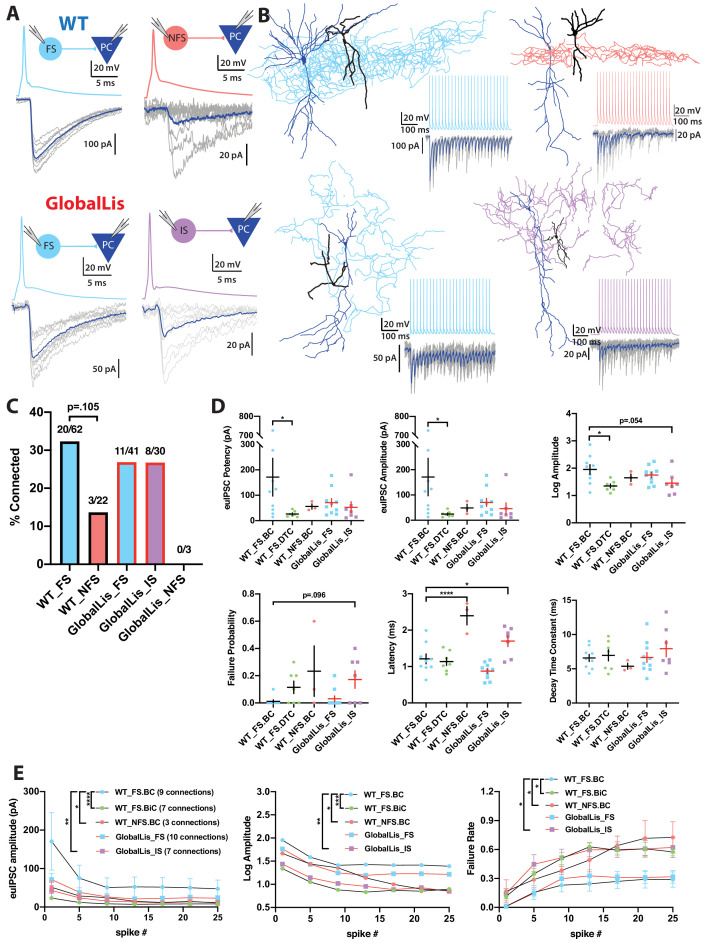
Figure 5. Connectivity and microcircuitry of PV+INTs.
(A) (i) Examples of paired whole-cell recordings between synaptically connected presynaptic PV+INTs (top traces) and postsynaptic CA1 PCs (bottom traces). 10 individual traces (grey) and an averaged trace (navy) are show for the postsynaptic cells. Note that a high [Cl-] internal solution was used in the PCs, resulting in GABAergic inward currents when PCs were clamped at −70 mV. (B) Reconstructions of PV+INTs (dendrite/cell body in black, axon in light blue, pink or purple) and PCs (dendrite/cell body in navy) and sample traces of a 50 Hz, 25 pulse stimulation. (C) Connectivity of PV+INT to PCs. Note the lower connectivity of NFS cells. (D) Unitary transmission properties between PV+INTs and PCs. (E) Short-term plasticity of PV+INT microcircuits during a 50 Hz, 25 pulse train. For statistical analysis *p<0.05, **p<0.01, ***p<0.001, ****p<0.0001.


