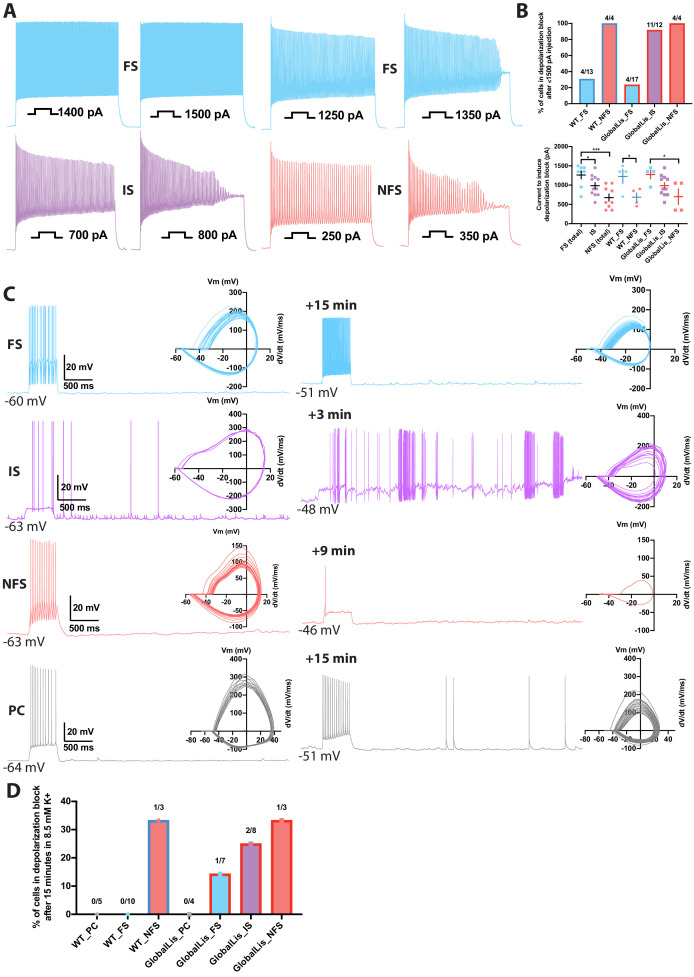
Figure 6. Depolarization block in PV+INTs.
(A) Maximum firing frequencies and depolarizing block in subtypes of PV+INTs. Top left shows FS cell which showed no reduction in firing frequency after current injection of 1500 pA. Top right displays FS cell, bottom left displays IS cell, and bottom right displays NFS cell, all of which blocked. (B) Percentages of PV+INT subtypes that went into depolarization block with current injection of 1500 pA or less. For statistical analysis *p<0.05, **p<0.01, ***p<0.001. (C) Traces of PV+INTs in 3.5 mM extracellular [K+] (left) and after 8.5 mM extracellular [K+] (right) with inset phase plots. The IS cell example (second from top) shows the cell transitioning into depolarizing block and losing the ability to initiate action potentials. The NFS cell example (third from top) trace in 8.5 mM K+ shows the last action potential this cell was able fire before completely entering depolarization block. (D) Left side displays percentages of PCs and PV cells in depolarization block after 15 min or less in 8.5 mM extracellular [K+]. Right side displays percentages of PV+INT physiological subtypes.

