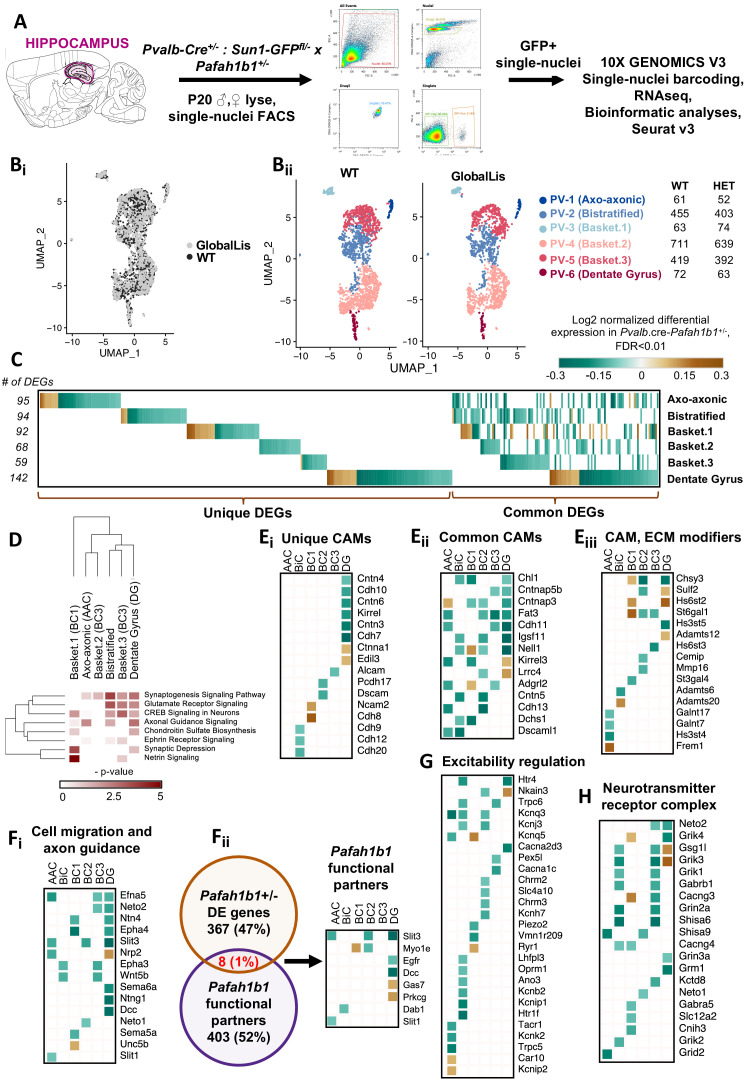
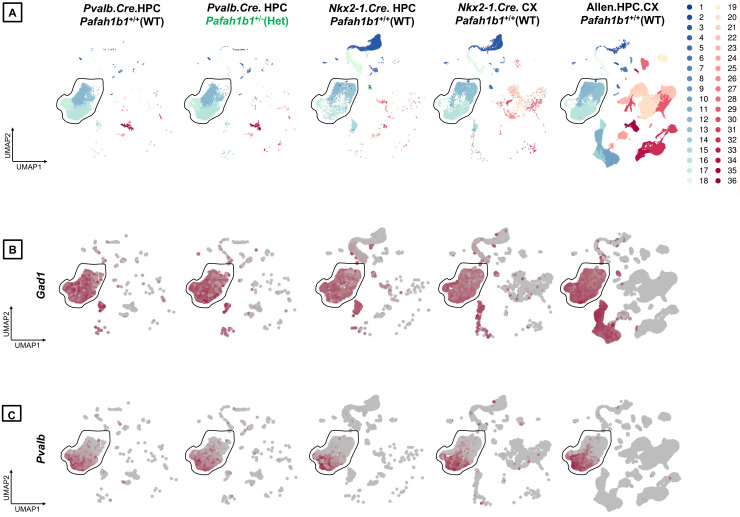
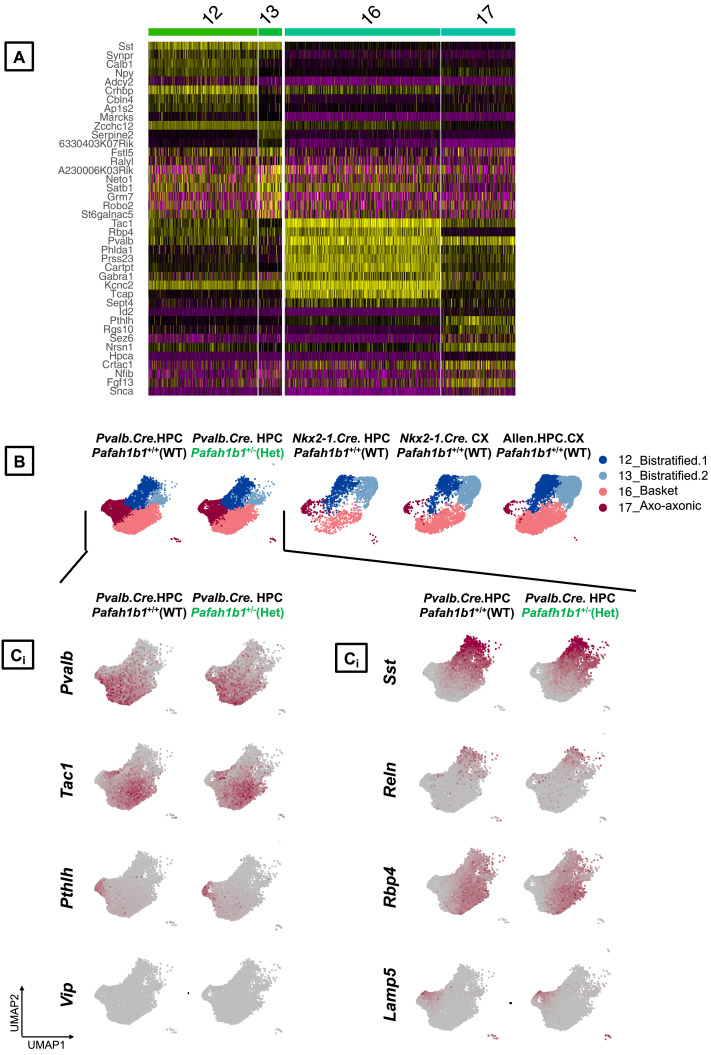
Figure 7. Examination of Pafah1b haploinsufficiency on PV+INTs using single-nucleus RNA-seq.
(A) Overview of the experimental workflow. (Bi) Uniform Manifold Approximation and Projection (UMAP) dimensional reduction of single-nuclei transcriptomes of hippocampal PV+INTs, highlighting similar enrichments of the clusters between genotypes. (Bii) UMAP visualization of Axo-axonic, Bistratified and Fast-spiking PV+INT subtypes, and table indicating the number of Gad1/Pvalb+ cells recovered in each PV+INT. Cell clusters were color coded and annotated post hoc based on their transcriptional profile identities (Abbreviations: FS, Fast-spiking; DG, Dentate gyrus). (C) Combined heatmap representing the 376 differentially expressed (DE) in hippocampal PV+INTs upon Pafah1b1 haploinsufficiency, at FDR < 0.01 and Fold Change (FC) >10%, as determined by MAST analysis. (D) Ingenuity Pathway Analysis of significantly overrepresented molecular pathways in each PV+INT subtype. (E–H) Heatmap of log2 FC of significant DE genes in each PV+INT subtype, showing a subset of (Ei) uniquely DE cell-adhesion molecules (CAMs), (Eii) commonly DE CAMs, Eiii, DE extracellular matrix modifying genes; (Fi), genes regulating neuronal migration and axon guidance, (Fii), genes that exist in a genetic and biochemical complex with Pafah1b1. (G) regulators of neuronal excitability, and (H) postsynaptic glutamate receptor subunits and associated auxiliary subunits.


