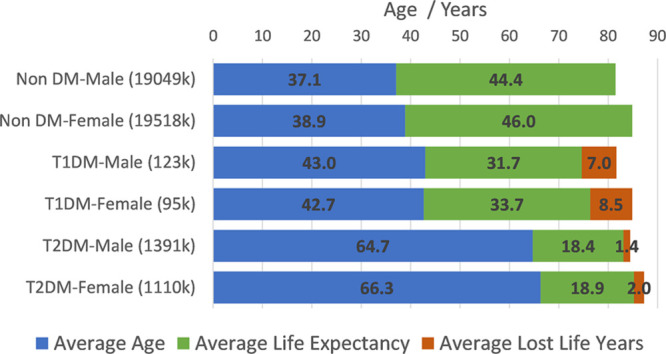
Fig. 1.

National average age, life expectancy in years for the non diabetes mellitus, T1DM and T2DM populations split by sex. The orange section reflects the LLYs corresponding to the life expectancy gap between the non diabetes mellitus population and T1DM/T2DM individuals. The longer blue bars for T2DM relate to the later age of onset than T1DM. T1DM, type 1 diabetes mellitus; T2DM, type 2 diabetes mellitus.
