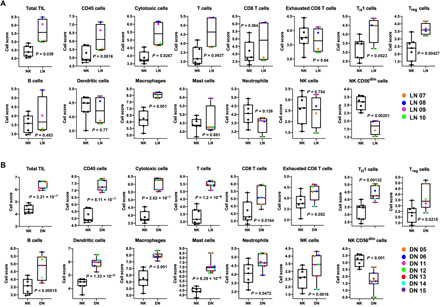
Fig. 2. Immune cell profiling of kidney biopsies from LN, DN, and healthy individuals (NK) with NanoString nCounter Autoimmune Profiling panel.

Shown here is the pairwise comparison of the abundance of the total tissue-infiltrating leukocytes (TILs) and the individual immune cell types between for (A) LN (n = 4 patients) and NK (n = 7 individuals) samples and (B) DN (n = 7 patients) and NK (n = 7 individuals) samples. The abundance of the different immune cell types (at the RNA level) in the kidney biopsies was calculated as log2 cell type scores (see Materials and Methods) and is presented as box and whisker plots. The data are reported as the median (horizontal line), first (top box), and third (bottom box) quartiles, and each symbol represents a single LN, DN, and NK individual. Statistical significance for the comparative cell type abundance was calculated using two-tailed Student’s t test. The cell scores for a specific cell type can only be compared between two groups (such as NK and LN) but do not support claims that a cell type is more abundant than another cell type within the same group.
