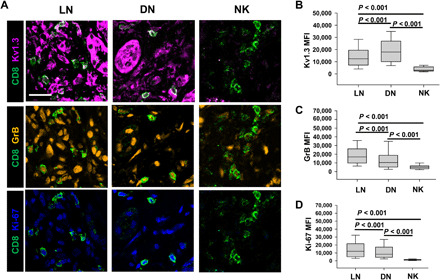
Fig. 3. CD8+ T cells in LN kidneys show increased cytotoxicity and proliferation.

(A) Representative merged confocal images of kidney biopsy sections stained for CD8 (green), Kv1.3 (magenta), GrB (cytotoxicity marker; orange,), and Ki-67 (proliferation marker; blue) in LN, DN, and NK individuals. Scale bar, 25 μm. (B to D) Fluorescence intensities (measured as mean gray values) of Kv1.3 (B), GrB (C), and Ki-67 (D) in CD8+ T cells in kidney biopsies from LN, DN, and NK individuals. In (B) to (D), data are presented as box and whisker plots. The data are reported as the median (horizontal line), first (top box), and third (bottom box) quartiles for 675 CD8+ T cells from 10 LN kidneys, 520 cells from 10 DN kidneys, and 36 cells from 10 NK kidney biopsies. Data were analyzed by one-way ANOVA [P < 0.001 for (B) to (D)]. Post hoc testing was performed by Dunn’s test.
