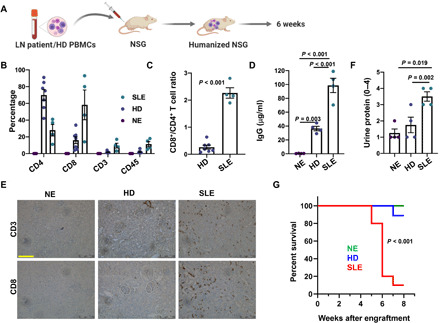
Fig. 5. Humanized mouse generated by engraftment of LN PBMCs exhibits LN-like phenotype.

(A) Schematic of humanized mouse model generation by engraftment of a NSG mouse with PBMCs from either a patient with LN or an HDs. (B) Left: Splenic T cell abundance in LN and HDs engrafted, as well as NE, mice measured by flow cytometry 6 to 8 weeks after engraftment. Human-specific antibodies were used to detect the T lymphocyte markers presented in the figure. (C) The ratio of CD8+ T cells to CD4+ T cells measured in splenocytes from LN and HDs mice. (D) Serum IgG levels (human) measured 6 weeks after engraftment in LN, HDs, and NE mice. (E) IHC of CD3 and CD8 expression (brown signal) in kidney tissues harvested from LN, HDs, and NE mice 6 weeks after engraftment. Representative image is shown here. Scale bar, 100 μm. (F) Urine protein measured in LN and HDs engrafted, as well as NE, mice. (G) Survival in LN, HDs, and NE mice presented as Kaplan-Meier Survival curve. Significance was evaluated by a log-rank test. All experiments were performed 6 to 8 weeks after engraftment. PBMCs from three SLE/LN individuals and two HDs were used for engrafting 4 to 12 mice per group. Bars represent means ± SEM, and each symbol represents an individual mouse. In (B), the CD4, CD8, CD3, and CD45 abundances were compared between the NE, HDs, and LN groups by one-way ANOVA (P < 0.001 for all groups). Data in (C) were analyzed by Student’s t test, while data in (D) and (F) were analyzed by one-way ANOVA (P < 0.05) and post hoc testing was performed by Holm-Sidak method.
