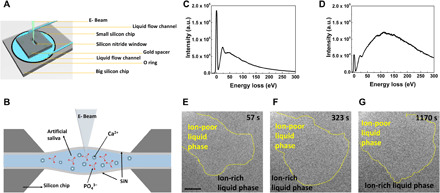
Fig. 1. The evidence of liquid-liquid phase separation within artificial saliva solution by liquid cell TEM imaging.

(A and B) Schematic of the in situ liquid cell, where (A) is the top view and (B) is the cross-sectional view. EELS data in (C) are from a dry silicon nitride cell and in (D) are collected from a liquid-filled cell. a.u., arbitrary units. (E to G) Time sequential TEM snapshots of the liquid-liquid separation process. The yellow dashed line marks the boundary between the ion-rich liquid phase and the ion-poor liquid phase. Scale bars, 500 nm.
