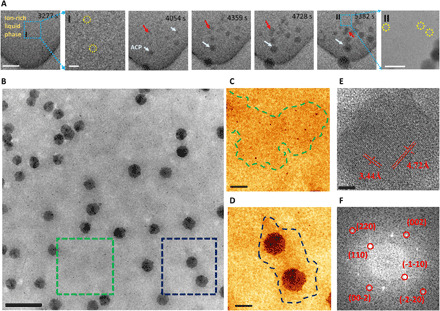
Fig. 2. The simultaneous homogeneous nucleation of HA and ACP within the ion-rich liquid phase.

(A) Time sequential TEM images of ACP nanoparticles formed within the ion-rich liquid phase. Scale bars, 500 nm. I: Zoomed-in TEM image of the blue boxed area in (A) at 3277 s. Scale bar, 200 nm. II: Zoomed-in TEM image of the blue boxed area in (A) at 5382 s. Scale bar, 200 nm. (B) TEM images of the ion-rich liquid phase and ion-poor liquid phase. The red arrows indicate ACP particle growth by coalescence. The HA crystals are marked by yellow circles in zoomed-in images I and II. (C) Zoomed-in TEM image of the green boxed area showing some HA nuclei within the ion-rich liquid phase. (D) Zoomed-in TEM images of the blue boxed area in (B) showing two ACP nanoparticles in ion-rich liquid phase zone. The blue dashed line marks the interface between the ion-rich liquid phase and the ion-poor liquid phase. Scale bars, 500 nm (B) and 100 nm (C and D). (E) High-resolution TEM image of the HA nanoparticles. Scale bar, 5 nm. (F) FFT image of (E).
