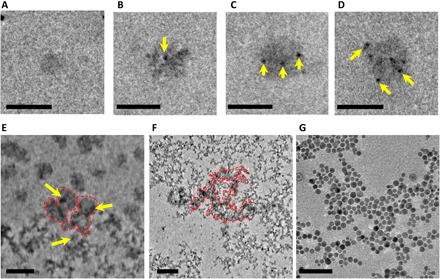
Fig. 3. TEM images of ACP and HA particles at different stages of ACP-to-HA transformation process.

(A) Formation of small ACP nanoparticle with a diameter of ~50 nm. (B) First HA nucleus (yellow arrow) forms on ACP nanoparticle. (C) Three HA nuclei (yellow arrows) form on ACP nanoparticle. (D) Six HA nuclei form on ACP nanoparticle. Scale bars, 100 nm (A to D). (E) Part of ACP (red dashed line) has transformed to HA (yellow arrow). (F) Partial dissolution of ACP nanoparticles, where the traces of undissolved ACPs are still visible within the red dashed line region. Scale bars, 200 nm (E and F). (G) Full transition of ACPs to HA. Scale bars, 50 nm (G).
