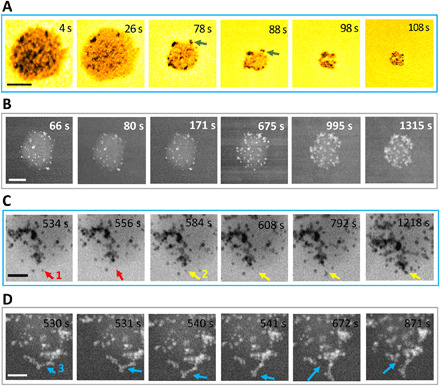
Fig. 4. Time sequential images of single ACP nanoparticle transforming to HA.

(A) TEM images showing the nucleation of HA with the dissolution of ACP in artificial saliva. Green arrows indicate that the HA crystals are attached to the surface of the ACP substrate. (B) HAADF-STEM images showing the heterogeneous nucleation of HA on the ACP substrate and the growth of HA by agglomeration and coalescence. Scale bars, 100 nm (A and B). (C) High-magnification BF-STEM images showing HA coalescence on the surface of an ACP nanoparticle. The red and yellow arrows point to HA nanoparticles that move to different locations to coalescence. Scale bar, 50 nm. (D) HAADF-STEM images show that HA nanoparticles coalescence and detach from the ACP surface. Scale bar, 50 nm. The blue arrow (location 3) indicates the position where the HA detachment happens.
