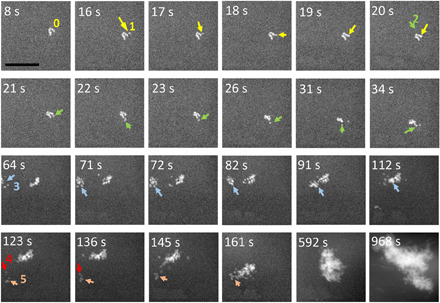
Fig. 5. Agglomeration and coalescence of HA crystals.

Time sequential images directly show HA nucleation, agglomeration, and coalescence process. Nucleus 1 labeled by yellow arrow represents one HA nucleus attaching to a larger HA cluster. Nucleus 2 labeled by green arrow represents one HA nucleus attaching to cluster and jumping from one position to another position after its nucleation. Cluster 3 labeled by blue arrow represents one cluster attaching to another cluster. Arrows 4 and 5 show that new nuclei first attach to a small cluster and then the cluster merges to a larger cluster. Scale bar, 100 nm.
