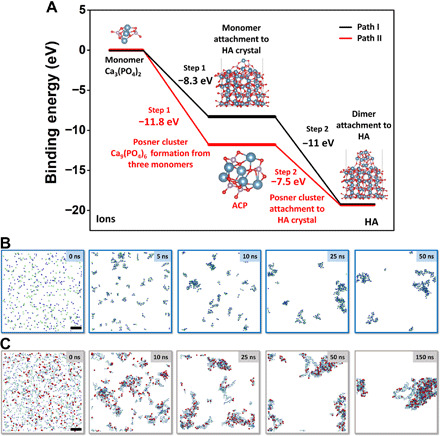
Fig. 6. Simulations of HA nucleation process.

(A) DFT simulations of the binding energy needed to form HA. (B and C) MD calculation of ACP and HA formation in solution. (A) Path I: Black curve denotes the nucleation and growth pathway by directly adding Ca3(PO4)2 to HA crystal, which features two steps, with step 1 being the attachment of one Ca3(PO4)2 to HA surface and step 2 being the subsequent attachment of another two Ca3(PO4)2 monomers to the surface. Path II: Red curve denotes the mineralization process with ACP as an intermediate phase, which features two steps, with step 1 being the formation of Posner cluster Ca9(PO4)6 from three Ca3(PO4)2 as the main component of ACP and step 2 being the attachment of ACP to HA crystal surface. (B) Formation of ACP from 300 Ca2+ and 200 PO43− ions; the frames correspond to 0-, 2-, 5-, 10-, 25-, and 50-ns simulation time, respectively. Ca2+, dark blue spheres; PO43−, pale green tetrahedra. (C) Formation of HA from 1000 Ca2+, 600 PO43−, and 200 OH− ions in a 15 nm × 15 nm × 15 nm water box. The frames correspond to 0-, 5-, 10-, 25-, 25-, 50-, and 150-ns simulation time, respectively. This ion fraction yields pure HA, Ca5(OH)(PO4)3. Ca2+, dark blue spheres; PO43−, pale green tetrahedra; OH−, red bispherical rods. To emphasize the distribution of OH units (related to the HA-rich phase), the size of calcium and phosphate ions was scaled down to 60%. Scale bars, 2 nm (B and C).
