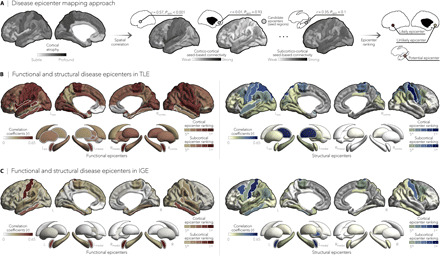
Fig. 3. Syndrome-specific disease epicenters.

(A) Disease epicenter mapping schema. Spatial correlations between cortical atrophy patterns and seed-based cortico- and subcortico-cortical connectivity were used to identify disease epicenters in TLE and IGE. Epicenters are regions whose connectivity profiles significantly correlated with the syndrome-specific atrophy map; statistical significance was assessed using spin permutation tests. This procedure was repeated systematically to assess the epicenter value of every cortical and subcortical region, as well as in both functional and structural connectivity matrices. (B and C) Correlation coefficients indexing spatial similarity between TLE- and IGE-specific atrophy and seed-based functional (left) and structural (right) connectivity measures for every cortical and subcortical region. Regions with significant associations were ranked in descending order based on their correlation coefficients, with the first five regions identified as disease epicenters (white outline). In TLE, ipsilateral temporo-limbic cortices (functional: Pspin < 0.05, structural: Pspin < 0.1) and subcortical areas—including ipsilateral amygdala (functional: Pspin < 0.05), thalamus (functional: Pspin < 0.05, structural: Pspin < 0.01), pallidum (functional: Pspin < 0.05), putamen (functional: Pspin < 0.05), and hippocampus (functional: Pspin < 0.1)—emerged as disease epicenters. In IGE, the highest ranked disease epicenters were located in bilateral fronto-central cortices, including postcentral gyri (functional: Pspin < 0.05, structural: Pspin < 0.05), left (functional: Pspin < 0.005, structural: Pspin < 0.1) and right amygdala (functional: Pspin < 0.005), and left pallidum (structural: Pspin < 0.1). *Pspin < 0.1, n.s., nonsignificant.
