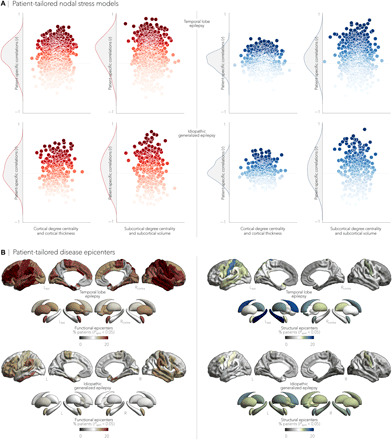
Fig. 5. Patient-tailored atrophy modeling.

(A) Patient-specific associations between degree centrality (denoting hub distribution) and individualized atrophy maps showed high stability between functional cortico-cortical hubs and cortical atrophy in TLE (Pspin < 0.05 in 22.4% of patients) and high stability between structural cortico-cortical hubs and cortical atrophy in IGE (Pspin < 0.05 in 15.2% of patients). (B) We identified patient-specific structural and functional disease epicenters by keeping brain regions whose connectivity profiles significantly correlated with the patient’s atrophy map (Pspin < 0.05). In TLE, ipsilateral temporo-limbic regions and subcortical areas (including the hippocampus) were most often identified as epicenters of gray matter atrophy, whereas in IGE, bilateral fronto-central (including sensorimotor cortices) and subcortical areas most often emerged as disease epicenters. Disease epicenters in individual patients strongly resembled those seen across the group as a whole.
