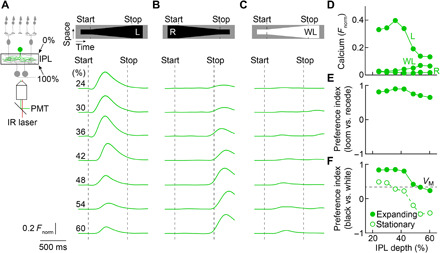
Fig. 2. Dendritic processing of visual stimuli in VG3 amacrine cells.

(A to C) Two-photon imaging of calcium transients in VG3 dendrites (VG3-Cre Ai148 mice) during looming (A), receding (B), and white looming (C). IR, infrared; PMT, photomultiplier tube. Green traces indicate the mean (shaded areas, almost indistinguishable from the green lines, indicate ± SEM) responses of dendritic regions of interest (ROIs) at different depths of the inner plexiform layer (IPL; 24%: n = 68 ROIs; 30%: n = 138 ROIs; 36%: n = 137 ROIs; 42%: n = 153 ROIs; 48%: 163 ROIs; 54%: n = 162 ROIs; 60%: n = 329 ROIs). (D) Average (± SEM) response amplitudes plotted as a function of IPL depth. Error bars indicating SEM are not visible because they are smaller than the circles. For IPL depths, 24 to 36% R and WL responses were not significantly different (P > 0.11); all other responses at all IPL depths were significantly different (P < 3.3 × 10⁻⁹, Friedman’s test with Tukey-Kramer post hoc analysis). (E and F) Summary data (means ± SEM) of preference indices for looming versus receding (E) and black versus white stimuli (F; expanding: filled circles; stationary: empty circles) across IPL depths. Error bars indicating SEM are not visible because they are smaller than the circles. For the preference index for looming versus receding (E), P = 1.3 × 10⁻²¹ for the main effect of IPL depth, Kruskal-Wallis test. By Tukey-Kramer post hoc analysis, pairwise comparisons showed statistically significant differences (P < 0.02) for 24 versus 54% and versus 60%, for 30 versus 48 to 60%, for 36 versus 48 to 60%, and for 42 versus 48 to 60%. For the preference index for looming versus white looming (F), P = 0 for the main effect of IPL depth, Kruskal-Wallis test. By Tukey-Kramer post hoc analysis, all pairwise comparisons revealed statistically significant differences (P < 0.02) except for 24 versus 30 to 42%, for 30 versus 36% and versus 42%, for 36 versus 42%, and for 54 versus 60%. For the preference index for black versus white stationary (F), P = 0 for the main effect of IPL depth, Kruskal-Wallis test. By Tukey-Kramer post hoc analysis, all pairwise comparisons revealed statistically significant differences (P < 0.02) except for 24 versus 30% and versus 36%, for 30 versus 36%, for 36 versus 42%, and for 54 versus 60%. At all depths, the preference index for black versus white looming was greater than that for stationary stimuli (P = 0 for a comparison across all depths and P < 10−9 for comparisons at each depth, Wilcoxon signed-rank test). In (F), the preference index for looming versus white looming for voltage responses (VM) is shown by a dashed line.
