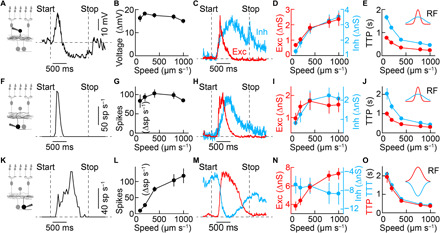
Fig. 4. Parallel parameter estimation in divergent circuits.

(A and B) Representative trace (A) and summary data (B) of VG3 amacrine cell voltage responses to looming with varying speeds of expansion. The speed for all representative traces in this figure is 400 μm s−1. VG3 amacrine cells responses varied slightly with speed (n = 8 cells; P = 0.038, Friedman’s test). (C to E) Representative traces (C) of excitatory and inhibitory inputs to VG3 amacrine cells and summary data of the amplitude (D) and latency (E; time to peak) of excitatory (n = 11 cells) and inhibitory (n = 12 cells) conductances at varying speeds of expansion. Excitation and inhibition increased in amplitude (excitation: P = 9.3 × 10⁻⁷; inhibition: P = 5 × 10⁻⁹; Friedman’s test) and decreased in latency (excitation: P = 1.3 × 10⁻⁸; inhibition: P = 2.8 × 10⁻⁹; Friedman’s test) with increasing stimulus speeds. Across speeds, inhibition was slower than excitation (P = 1.5 × 10⁻⁵, bootstrapping). (F and G) Representative trace (F) and summary data (G) for W3 spike responses, which did not vary significantly as a function of stimulus speed (n = 5 cells; P = 0.31, Friedman’s test). (H to J) Representative traces (H) of excitatory and inhibitory inputs to W3 ganglion cells and summary data of the amplitude (I) and latency (J) of excitatory and inhibitory conductances at varying speeds of expansion (n = 5 cells). Inhibition, but not excitation, increased significantly in amplitude (excitation: P = 0.14; inhibition: P = 0.032; Friedman’s test), and both decreased in latency (excitation: P = 5 × 10⁻⁴; inhibition: P = 5 × 10⁻⁴; Friedman’s test) with increasing stimulus speed. Across speeds, inhibition was slower than excitation (P = 0.01, bootstrapping). (K and L) Representative trace (K) and summary data (L) for OFFα spike responses, increasing with stimulus speed (n = 4 cells; P = 0.0086, Friedman’s test). (M to O) Representative traces (M) of excitatory and inhibitory inputs to OFFα ganglion cells and summary data of the amplitude (N) and latency (O) of excitatory and inhibitory conductances. Excitation increased and inhibition decreased in amplitude with increasing stimulus speed (excitation: n = 4 cells, P = 0.0016; inhibition: n = 5 cells, P = 0.0037; Friedman’s test). The latency of excitation was not significantly different from that of inhibition (P = 0.45, bootstrapping), and both decreased with stimulus speed (excitation: P = 0.003; inhibition: P = 5 × 10⁻⁴; Friedman’s test). Inset schematics in (E), (J), and (O) illustrate excitatory and inhibitory spatial receptive fields mapped with stationary dark spots (fig. S3). TTT, time to trough; TTP, time to peak; Exc, excitation; Inh, inhibition.
