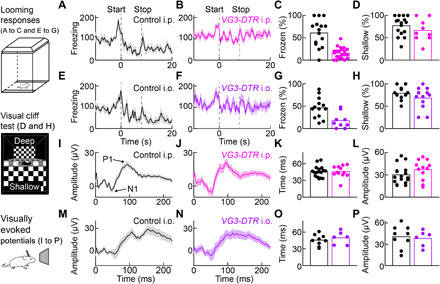
Fig. 7. Innate defensive responses to looming selectively depend on VG3 amacrine cells.

(A and B) Lines (shaded areas) indicate the mean (±SEM) freezing score traces in response to looming for VG3-DTR mice (B; n = 22 mice) and control littermates (A; n = 15 mice) injected intraperitoneally with DT. (C) Summary data comparing the fraction of time frozen between these groups of mice (VG3-DTR intraperitoneal and Ctrl intraperitoneal) from stimulus onset to 20 s later (stimulus duration: 8 s). P = 3.5 × 10⁻⁵, Mann-Whitney U test. (D) Summary data of the performance of VG3-DTR intraperitoneal (n = 9 mice) and Ctrl intraperitoneal mice (n = 15 mice) in a visual cliff test. For each mouse, the percentage of shallow-side choices in 10 trials was measured. P = 0.34, Mann-Whitney U test. (E to H) Analogous to (A to D), comparing VG3-DTR mice and control littermates injected intraocular with DT. For looming responses (E to G), VG3-DTR intraocular: n = 9 mice; Ctrl intraocular: n = 13 mice, P = 0.0066, Mann-Whitney U test. For the visual cliff test (H), VG3-DTR intraocular: n = 12 mice; Ctrl intraocular: n = 11 mice, P = 0.35, Mann-Whitney U test. (I and J) Lines (shaded areas) indicate the mean (±SEM) of visually evoked potentials recorded on skull electrodes above primary visual cortex in control (I; n = 17 mice) and VG3-DTR mice (J; n = 12 mice) 2 weeks after intraperitoneal injection of DT. (K and L) Summary data comparing implicit times (i.e., time to N1, P = 0.89, Mann-Whitney U test) and response amplitudes (i.e., P1-N1, P = 0.16, Mann-Whitney U test). (M to P) Analogous to (I) to (L) for control (n = 9 mice) and VG3-DTR mice (n = 6 mice) injected 2 weeks after bilateral intraocular injections of DT (implicit time: P = 0.52; amplitude: P = 0.78, Mann-Whitney U test). i.p., intraperitoneal; i.o., intraocular.
