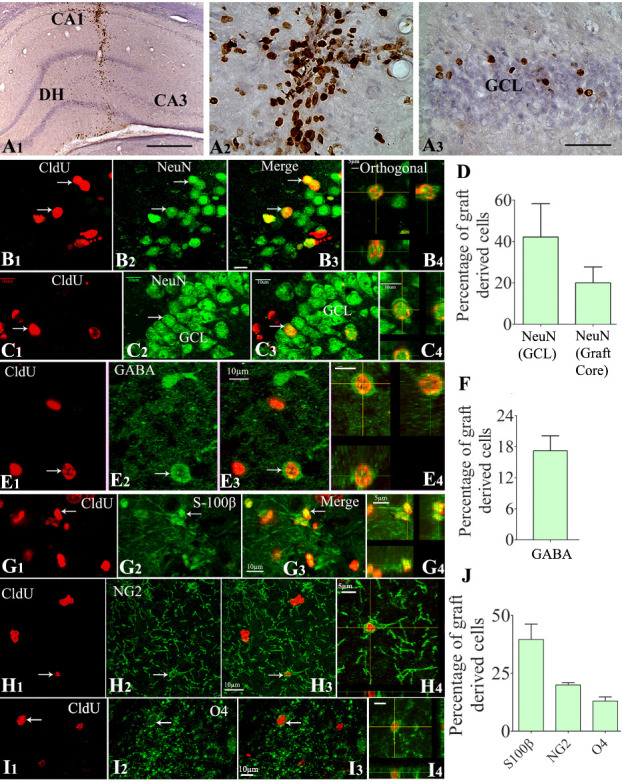
Figure 3.

Cells derived from neural stem cell (NSC) grafts displayed long-term survival and differentiated into all three neural cell types in the host hippocampus that underwent SE-induced injury. The top panel (A1-A3) shows the 5'-Chloro-2'-deoxyuridine CldU-positive graft-derived cells in the host hippocampus at ~9 months post-grafting (A1). A2 and A3 are magnified views of regions from A1, depicting the distribution of CldU+ cells in the graft core (A2) and neighboring dentate granule cell layer (GCL, A3). B1-C4 demonstrate samples of confocal Z section images visualizing graft-derived neurons positive for CldU and NeuN in the CA3 region (B1-B3) and the GCL (C1-C3). B4 and C4 show orthogonal views of graft-derived neurons expressing CldU-NeuN. The bar chart D depicts the overall neuronal differentiation of graft-derived cells in the GCL (neurogenic) and the graft core (D). Figures E1-E4 demonstrate graft-derived CldU+ cells expressing gamma-aminobutyric acid (GABA). E4 shows an orthogonal view of a graft-derived interneuron expressing CldU and GABA. The bar chart F depicts the overall % of graft-derived cells differentiating into GABA-ergic interneurons. Figures G1-I4 show the differentiation of graft-derived CldU+ cells into S-100ß+ mature astrocytes (G1-G3), NG2+ oligodendrocyte progenitors (G1-G3), and O4+ oligodendrocytes (I1-I3) in the host hippocampus. G4, H4, and I4 show the orthogonal view of a graft-derived astrocyte (G4), an oligodendrocyte progenitor cell (H4), and an oligodendrocyte (I4). The bar chart J shows the percentage of S-100ß+ astrocytes, NG2+ oligodendrocyte progenitors, and oligodendrocytes among graft-derived cells. Scale bars: A1, 200 µm; A2 and A3, 50 µm; B1-E4, G1-G3, H1-H3, and I1-I4, 10 µm; G4 and H4, 5 µm. DH, dentate hilus.
