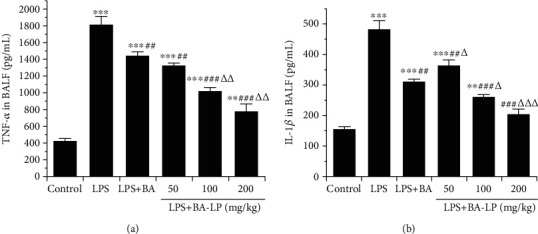
Figure 5.

Effect of BA on the levels of TNF-α (a) and IL-1β (b) in BALF. The values were presented as means ± SD (n = 5). ∗∗P < 0.01 and ∗∗∗P < 0.001 vs. the control group; ##P < 0.01 and ###P < 0.001, vs. the LPS group; and △P < 0.05, △△P < 0.01, and △△△P < 0.001 vs. the LPS+BA group.
