Figure 4.

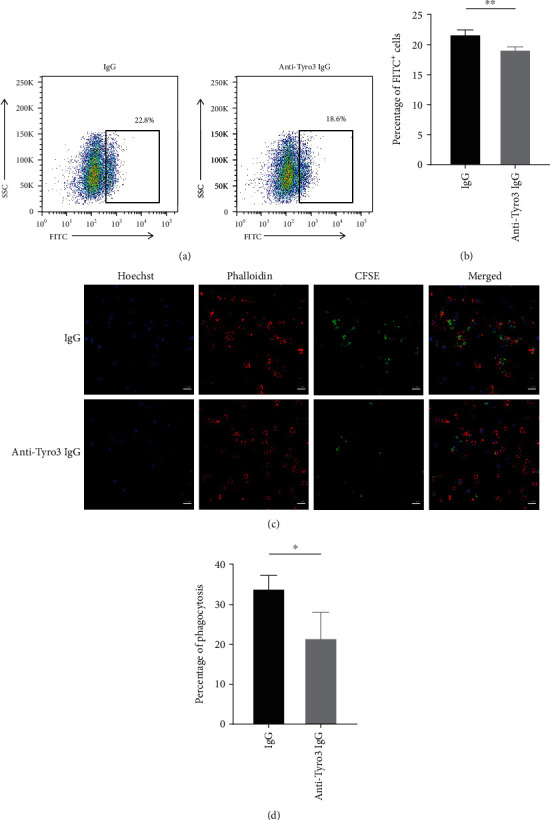
Autoantibody against Tyro3 receptor reduced macrophage efferocytosis by flow cytometry and immunofluorescence. (a) The efferocytosis of macrophages was analyzed by flow cytometry. (b) The statistical graph showing the flow cytometry data (n = 4). The values represent the mean ± SD. ∗∗p < 0.01. (c) Representative photograph of the efferocytosis of macrophages monitored by immunofluorescence, presented as merged pictures of Hoechst (blue), phalloidin (red), and CFSE (green). Bar, 20 μm. (d) Statistical data of the percentage of efferocytosis in 100x views of the confocal microscope (n = 3). The values represent the mean ± SD. ∗p < 0.05.
