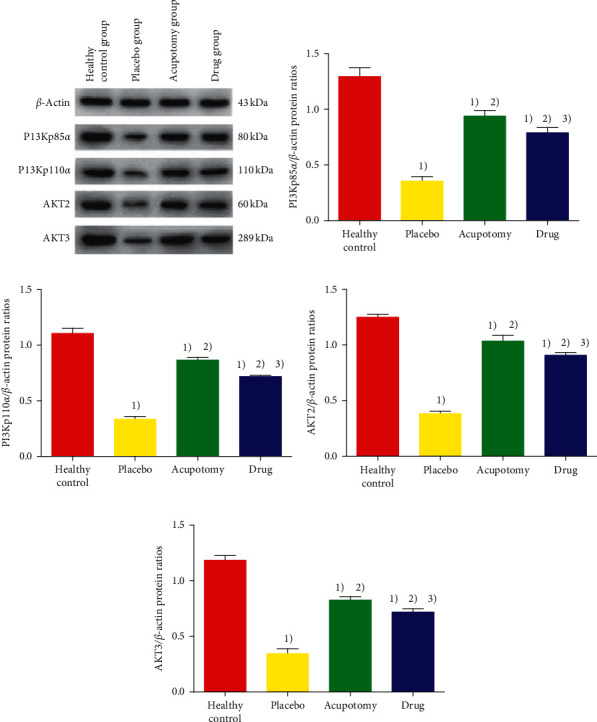
Figure 7.

Comparison of PI3K and Akt protein expression in rabbit knee cartilage. (a) Western blot band diagram of rabbit cartilage PI3K and Akt protein in each group. (b) The ordinate represents PI3Kp85α/β-actin protein ratios. (c) The ordinate represents PI3Kp110α/β-actin protein ratios. (d) The ordinate represents AKT2/β-actin protein ratios. (e) The ordinate represents AKT3/β-actin protein ratios. 2)P < 0.05 compared with the healthy control group; 2)P < 0.05 compared with the placebo group; 3)P < 0.05 compared with the acupotomy group.
