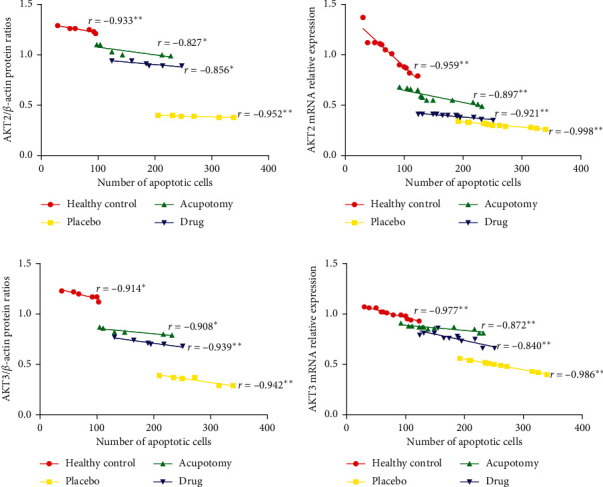
Figure 8.

Correlation analysis of chondrocyte apoptosis with Akt expression in rabbit knee cartilage. (a, b) Correlation analysis between the expression of AKT2 at the protein and mRNA levels and the number of apoptotic cells. (c, d) Correlation analysis between the expression of AKT3 at the protein and mRNA levels and the number of apoptotic cells; r correlation coefficient. (a) The ordinate represents AKT2/β-actin protein ratios. (b) The ordinate represents AKT2 mRNA relative expression. (c) The ordinate represents AKT3/β-actin protein ratios. (d) The ordinate represents AKT3 mRNA relative expression. ∗P < 0.05, ∗∗P < 0.01.
