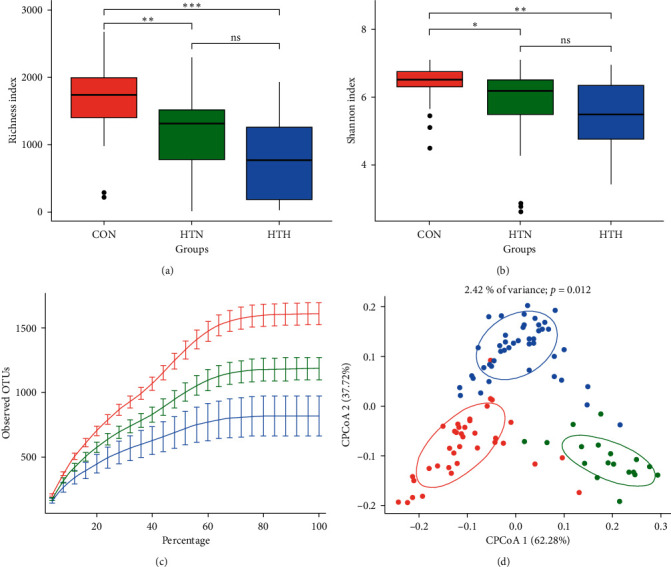
Figure 1.

The gut microbiota composition in healthy controls and HT patients with euthyroidism and hypothyroidism. Alpha diversity, including Richness index (a) and Shannon index (b). Rarefaction curves (c) and constrained principal coordinate analysis (CPCoA) (d) according to weighted Unifrac distances were carried out to assess beta diversity among controls (denoted as red circles), HT with euthyroid HT patients (green circles), and hypothyroidism (circles in blue). Ellipses correspond to the clustering of fecal samples for each group encircling 95% confidence interval. CON, healthy controls; HTN, patients bearing Hashimoto's thyroiditis with euthyroidism; HTH, HT patients with hypothyroidism.
