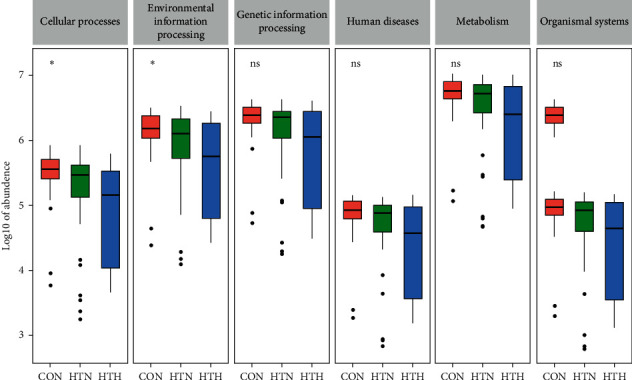
Figure 5.

The possible pathways related to gut microbiota change among the three groups. The abundance of predicted genes in each predicted pathway is indicated by boxplot. ∗P < 0.05 indicates significant.

The possible pathways related to gut microbiota change among the three groups. The abundance of predicted genes in each predicted pathway is indicated by boxplot. ∗P < 0.05 indicates significant.