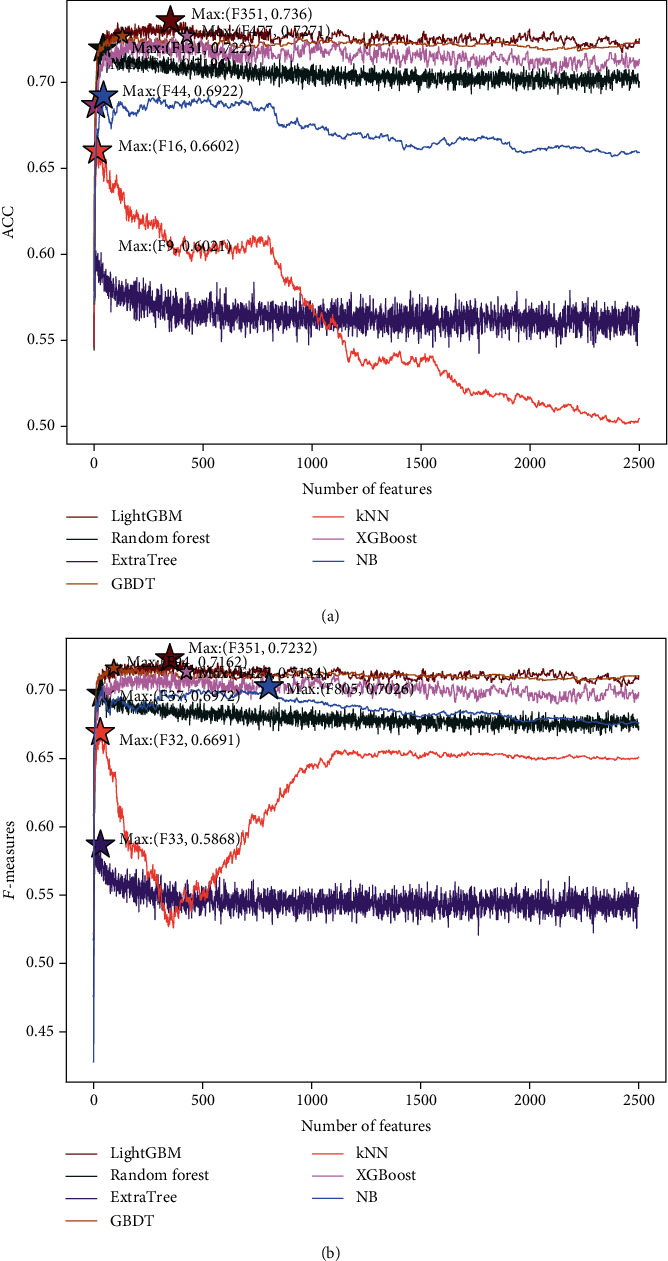
Figure 3.

IFS curve describing the ACC value and F-measure value of each classifier. On the basis of the dataset constructed as described in Materials and Methods, the IFS curve shows the trend of the (a) ACC values and (b) F-measure values of the seven classifiers as the number of input features increases. The seven classification algorithms are LightGBM, Random Forest, ExtraTree, GBDT, kNN, XGBoost, and NB.
