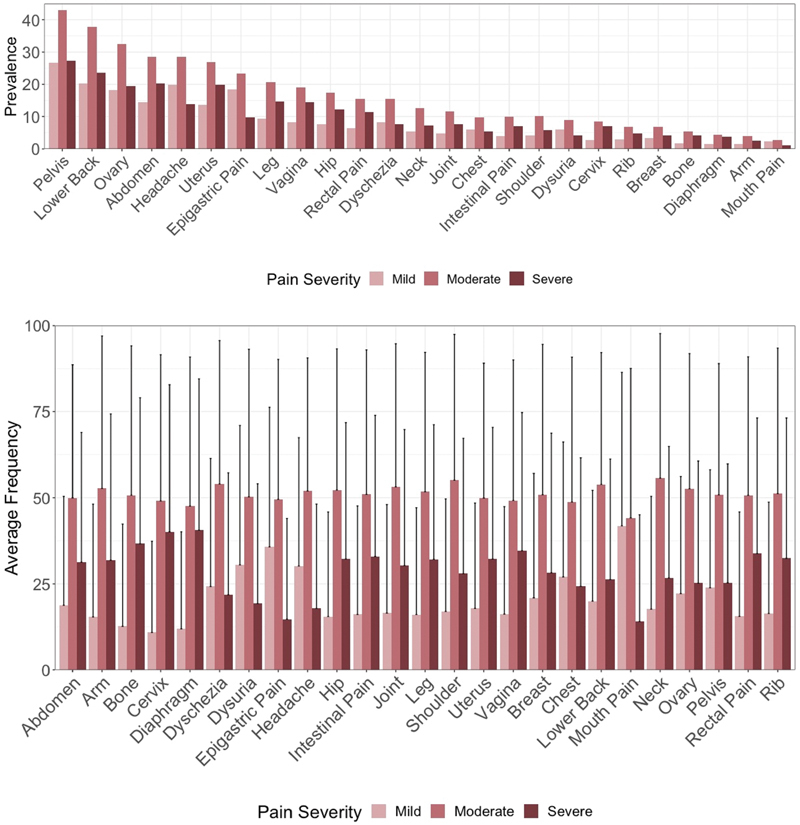
Fig. 2.

Top: Prevalence of mild, moderate, and severe pains by body location as reported in the Phendo cohort. Each body area-intensity pair counted once per participant. For all body locations, participants tracked predominantly moderate pain, with severe pain as second most common, and mild as least common. Bottom: Mean proportion of severity reported for each body area normalized by total tracks of pain reports and averaged across the sample. One-sided error bars were used for visual display purposes and represent standard deviations.
