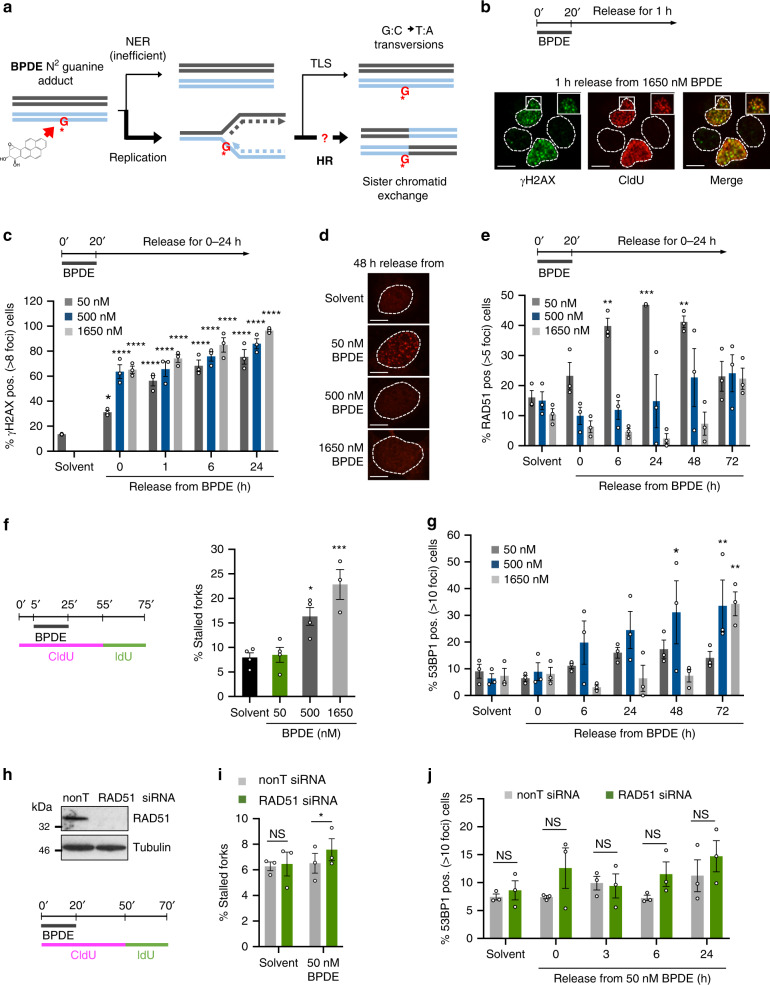
Fig. 1. Bulky DNA adducts induce RAD51 foci formation in absence of replication fork stalling or -collapse.
a Schematic of DNA repair and damage tolerance pathways induced by low doses of BPDE, which forms bulky adducts on guanine. NER: nucleotide excision repair; TLS: translesion synthesis; HR: homologous recombination. b Co-localization of γH2AX (green) and replication forks (CldU, red) in U2OS cells after 1 h release from 1650 nM BPDE treatment for 20 min. Images are representative of n = 2. Scale bars: 10 μm. c Percentages of U2OS cells with >8 γH2AX foci after release from increasing concentrations of BPDE. n = 3 d BPDE-induced RAD51 foci. Images are representative of n = 3. Scale bars: 10 μm. e Percentages of U2OS cells with >5 RAD51 foci after release from increasing concentrations of BPDE. n = 3. f Percentages of stalled forks after release from BPDE. U2OS cells were pulse-labeled with CldU, treated with BPDE during the CldU pulse, and released into IdU. n = 4 (1650 nM n = 3). g Percentages of cells with >10 53BP1 foci after release from increasing concentrations of BPDE. n = 3. h Top: Protein levels of RAD51 and α-Tubulin (loading control) in U2OS cells after 48 h depletion with RAD51 or non-targeting (nonT) siRNA. Images are representative of n = 2. Bottom: Strategy for DNA fiber labeling. i Percentages of stalled forks after release from 50 nM BPDE as shown in (h) in cells treated with nonT or RAD51 siRNA for 48 h. n = 3. j Percentages of control- or RAD51-depleted U2OS cells with >10 53BP1 foci after release from 50 nM BPDE. n = 3. Source data are provided as a Source Data file. The means and SEM (bars) of at least three independent experiments are shown. Asterisks indicate p-values compared to solvent unless indicated otherwise (one-way ANOVA and Dunnett’s test for C, E, F, G; one-sided student’s t-test for I, J, *p < 0.05, **p < 0.01, ***p < 0.001).

