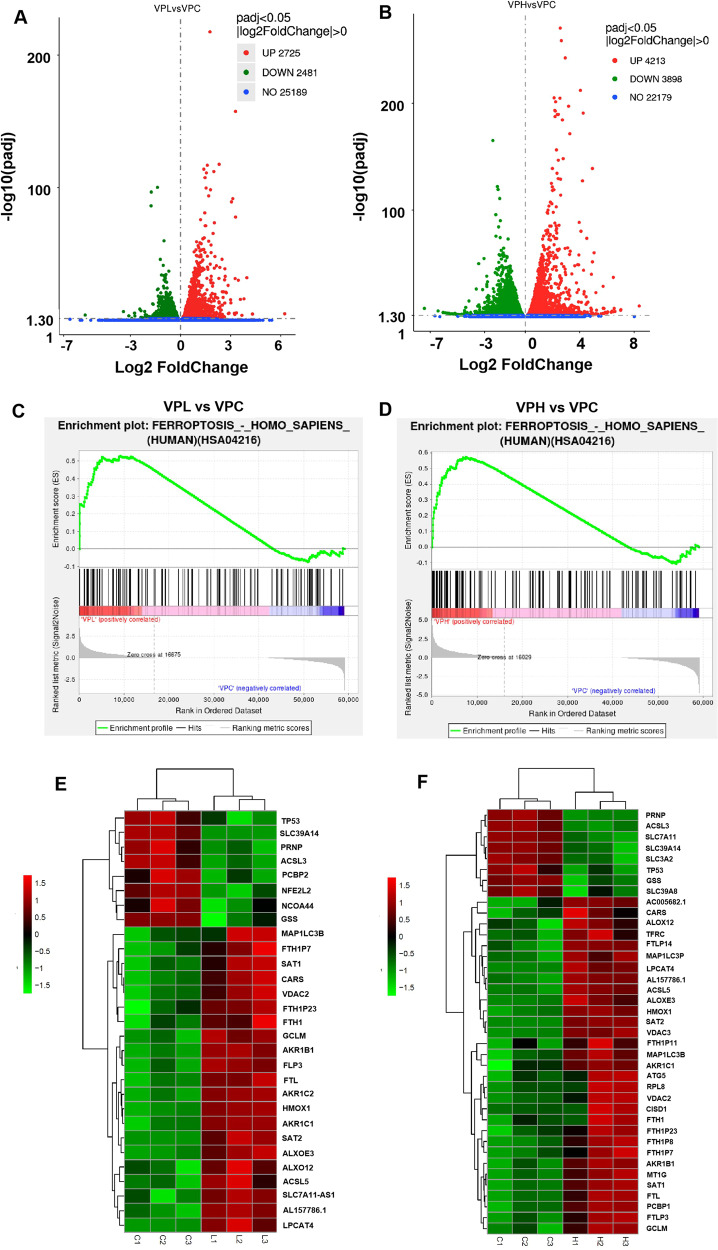
Fig. 4. TalaA treatment-induced transcriptome alteration.
The SW480 cells were treated with two concentrations of TalaA for 12 h. A Volcano plot showing the differences in RNA expression after 5.0 μM TalaA treatment. VPL means low concentration (5.0 μM) TalaA treatment; VPC means no chemical treatment (DMSO Control). B The volcano plot showing the differences in RNA expression after 10.0 μM TalaA treatment. VPH means high concentration (10.0 μM) TalaA treatment; VPC means no chemical treatment (DMSO control). C Through KEGG-enrichment analysis, it was found that the ferroptosis pathway molecules were up-regulated by 5.0 μM TalaA. D KEGG-enrichment analysis showed that the ferroptosis pathway molecules were up-regulated by 10.0 μM TalaA. E The heatmap data showed 5.0 μM TalaA resulted in gene expression alteration of ferroptosis-correlated molecules including FTL, SAT2, ALOXE3, GSS, ALOX12, HMOX1, ACSL5, and so on. F The heatmap data showed 10.0 μM TalaA resulted in gene expression alteration of ferroptosis-correlated molecules including FTL, SLC7A11, HMOX1, ALOXE3, SAT1, SAT2, GSS, ACSL5, ALXO12, PCBP1, MAP1LC3P, and so on.

