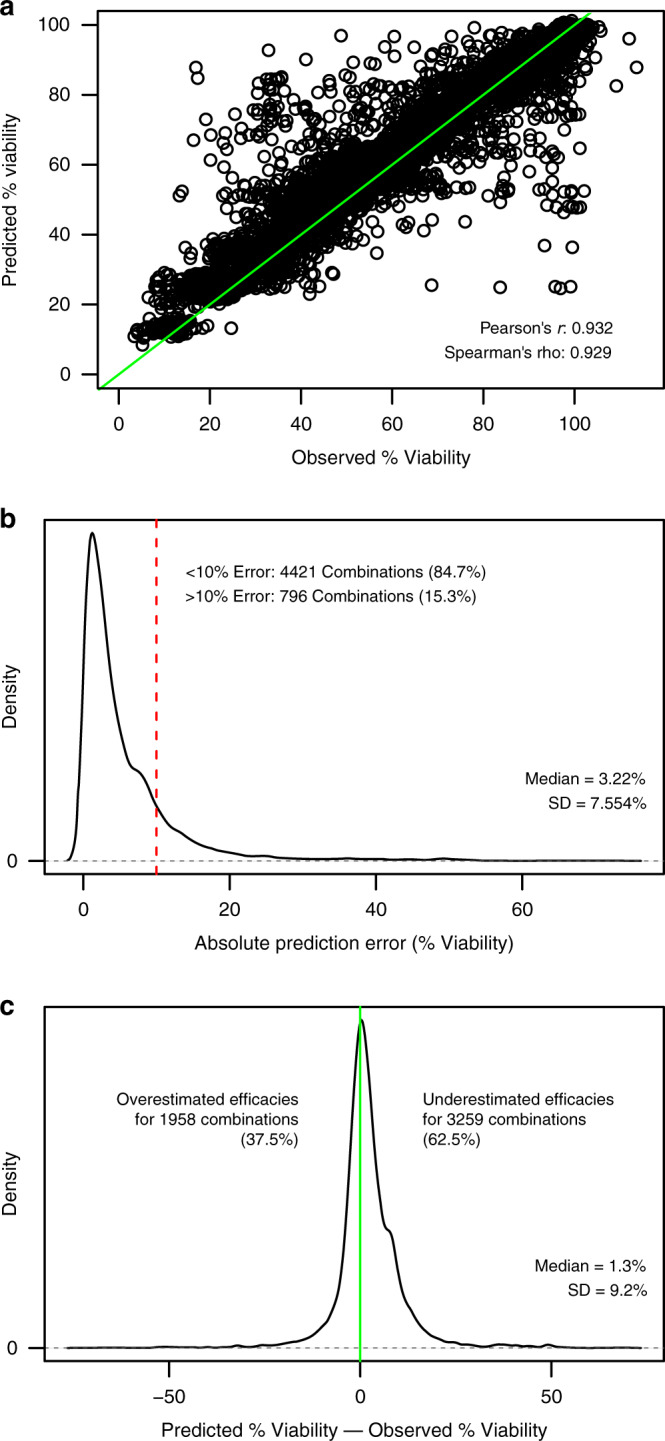
Fig. 2. Agreement between predicted and observed combination viabilities in NCI-ALMANAC.

a Scatterplot showing high correlation between predicted average percent viability and experimentally observed average percent viability for each drug combination in NCI-ALMANAC. Predictions were made using monotherapy data from the dataset. The green line is a reference diagonal with slope = 1 and intercept = 0. Note that predictions were only made for the maximum concentration tested for each drug. b Density plot showing that the absolute values of the differences between the predicted percent viabilities and the observed percent viabilities for each drug combination are generally below 10%, with >50% of drug combinations having an absolute prediction error below 5%. The red line marks a difference of ±10% viability between predicted and observed values. c Density plot showing that the differences between the predicted percent viabilities and the observed percent viabilities for each drug combination have a slight tendency towards being positive—indicating that IDA-Combo underestimates efficacy more often than it overestimates efficacies. Source data are provided as a Source Data file.
