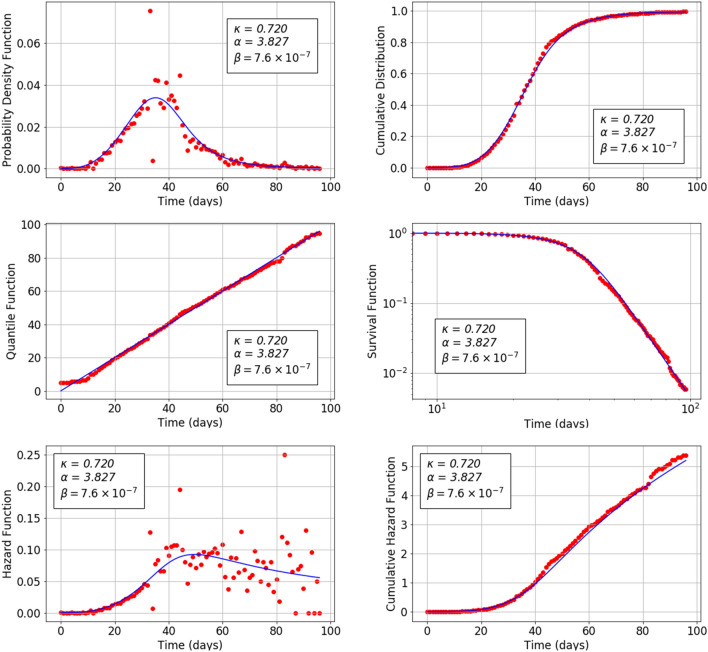
Figure 2.
Theoretical (continuous curve) and empirical (dots) plots of the probability density function (top left), cumulative distribution function (top right), quantile function (middle left), survival function (middle right), hazard function (bottom left) and cumulative hazard function (bottom right) versus time for the Covid-19 mortality data related to China 2020 epidemic. The theoretical curves are based on Eqs. (26), (25), (34), (21), (29) and (33) respectively.

