Figure 8.

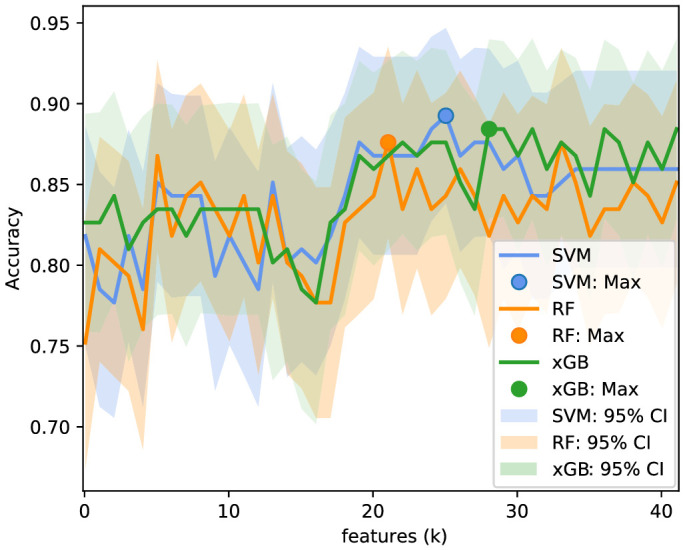
Accuracy for the selected features for each subset size . The same procedure was applied to all models, SVM (blue), RF (orange), and xGB (green), for classifying between the healthy control and glaucoma groups.

Accuracy for the selected features for each subset size . The same procedure was applied to all models, SVM (blue), RF (orange), and xGB (green), for classifying between the healthy control and glaucoma groups.